
FIGURE 3.
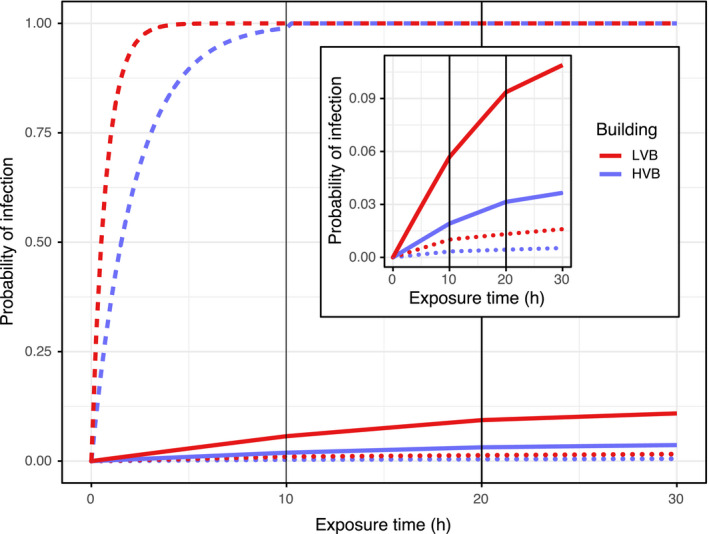
Probability of infection for a theoretical, susceptible roommate in LVB (low ventilated building) and HVB (high ventilated building) dormitory rooms for 3 days, where each day is assumed to have 10 h of exposure; solid lines represent median fine aerosol shedding rates (RNA copies/h) dots represent 10th percentile, and dashes represent 90th percentile, from a symptomatic population of influenza cases 4