
Figure 7.
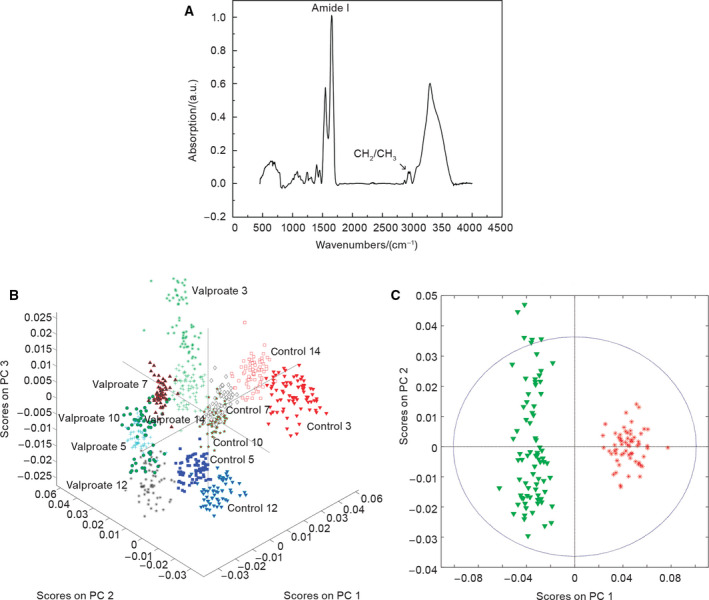
FTIR spectrum of a metabolome and the PCA. (A) Typical FTIR spectrum of a metabolome. The spectral ranges of interest were amide I band and CH 2 and CH 3 stretching vibrational bands (n = 6 groups of spent control media samples; n = 6 VPA‐supplemented groups of spent media samples). (B) Clustering of spectra according to the medium composition and the day of the culture when the spent medium was retrieved (3D PCA scatterplot). Scores on PC 1—16.94%, PC 2—10.55%, PC 3—5.60% (n = 6 groups of spent control media samples; n = 6 VPA‐supplemented groups of spent media samples). (C) 2D PCA scatterplot for all spectra retrieved from VPA‐treated teratoma (green) and control metabolomes (red) retrieved at the 3rd day of culture. Scores on PC 1—27.26%, PC 2—3.54%. (n = 6 groups of spent control media samples; n = 6 VPA‐supplemented groups of spent media samples).