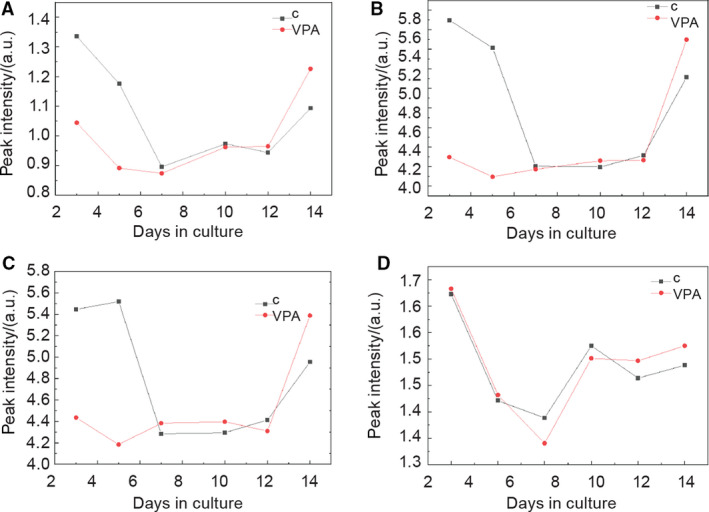
Figure 9.

Fitting results for peak intensity of four amide I protein vibrational bands. (A) β‐sheets at 1625 cm−1. (B) Unordered at 1641 cm−1. (C) α‐helix at 1660 cm−1. (D) Turn at 1683 cm−1. Black—control group, red—VPA‐supplemented group; n = 6 groups of spent control media samples collected on different days of culture; n = 6 VPA‐supplemented groups of spent media samples collected on different days of culture.
