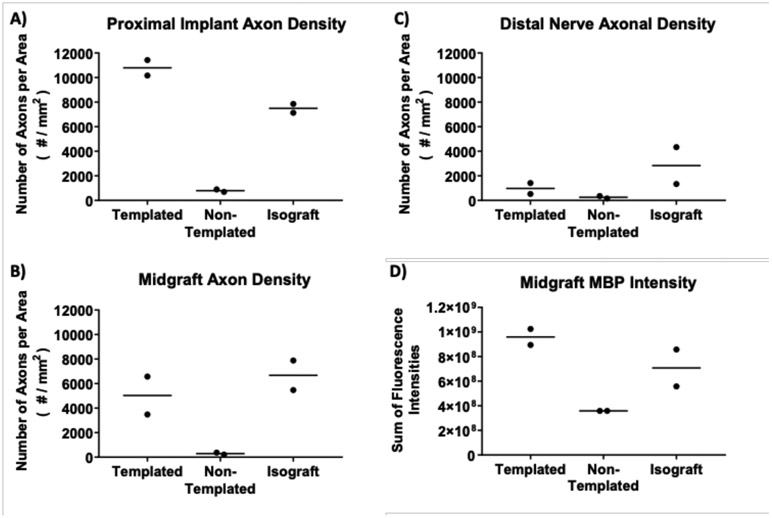
Figure 9. Image Quantification of Cell Growth Into and Across Magnetically Templated Hydrogels and Controls After 4-Weeks Implantation.
Axonal densities obtained through RT97 quantification of cross sections throughout the implant after 4-weeks in vivo, (n = 2 / group). Axonal density quantification shown at the proximal implant location, ~2 mm into the regenerated implants (A), the midgraft location (B), and the distal nerve location (C). Myelin basic protein (MBP) staining intensity quantified as a measure of Schwann cells at the midgraft location (D), (n = 2 / group). Each point represents the mean quantified value from 4-5 consecutive sections from one individual animal, and the horizontal line represents the group mean. Overall, magnetically templated hydrogels appeared to have higher axon density than non-templated hydrogels at every location, and higher MBP intensity at the midgraft location.

