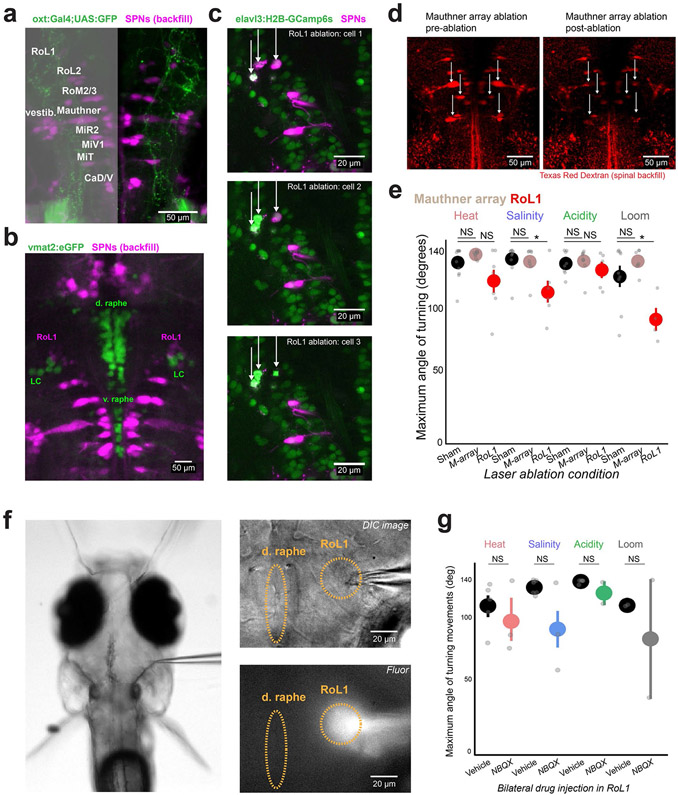
Extended Data Fig. 9 ∣. Details of RoL1 location, two-photon single-cell ablation of spinal projection neurons, and local injection of NBQX.
a, Location of spinal projection neurons (SPNs), with cell names, and axonal projections in Tg(oxt:Gal4; UAS:GFP) fish. b, Location of SPNs relative to monoaminergic cells, labeled with spinal backfill in a Tg(vmat2:eGFP) line. RoL1 neurons reside slightly anterior and medial to the noradrenergic neurons of the locus coeruleus. c, Example images showing sequential two-photon single-cell ablation of three RoL1 neurons in a Tg(elavl3:H2B-GCaMP6s) fish backfilled with Texas red dextran. This specificity and extent of ablation was confirmed across all N = 10 fish. d, Images of an example fish, backfilled with Texas red dextran, before and after bilateral ablation of the Mauthner neurons and segmental homologues (“M-array” ablation). This specificity and extent of ablation was confirmed across all N = 11 fish. e, Maximum tail angle of responsive movements - summary data from control and ablated fish. Mean ± s.e.m., individual fish are points. N = (11,11,10) - (sham, M-array, RoL1), left to right. Note that RoL1 neuron ablation reduced the maximum tail angle in response to some stimuli. One-tailed Mann-Whitney U tests, Benjamini-Hochberg false discovery rate correction for multiple comparisons. Same fish as Fig. 5h. NS = “not significant”, all p > 0.2. *p < 0.05. f, DIC image of embedded fish (agar around nose removed), with location of injection pipette entering from the fissure between the optic tectum and lateral cerebellum (left). Close-up image of injection area in DIC and fluorescence imaging to visualize drug/dye flow (right). Localized dye spread was confirmed across all injected fish. g, Maximum tail angle of responsive movements - summary data from in RoL1-injected fish (NBQX or vehicle). Mean ± s.e.m., individual fish are points. N = (6,6) - (vehicle, NBQX). One-tailed Mann-Whitney U tests, Benjamini-Hochberg false discovery rate correction for multiple comparisons. Same fish as Fig. 5k. NS = “not significant”, all p > 0.1. See Supplementary Table 2 for test statistics.

