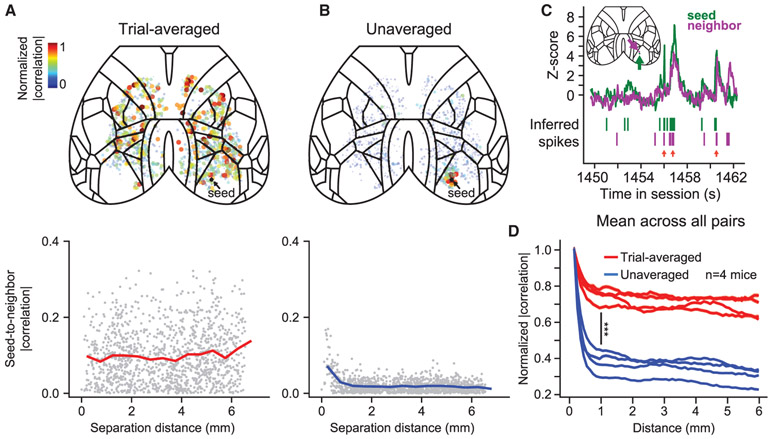
Figure 4. Unaveraged Data Exhibit More Localized Correlation Structure Than Trial-Averaged Data.
(A) Seeded trial-averaged activity correlations (for a single seed): top, spatial distribution; bottom, correlation versus distance to the seed (black dot).
(B) Seeded unaveraged activity correlations (format matches that in A).
(C) Example illustrating unaveraged activity correlation (locations indicated on atlas inset). Red arrows indicate time points when the seed source and its neighbor are active simultaneously.
(D) Summary across all mice of correlation analyses shown in (A) and (B). Lines for each mouse represent the mean correlation across all pairs of sources (binned and normalized). Statistic shown at 1-mm distance (***corrected p = 0.0001, paired t test; n = 4 mice).

