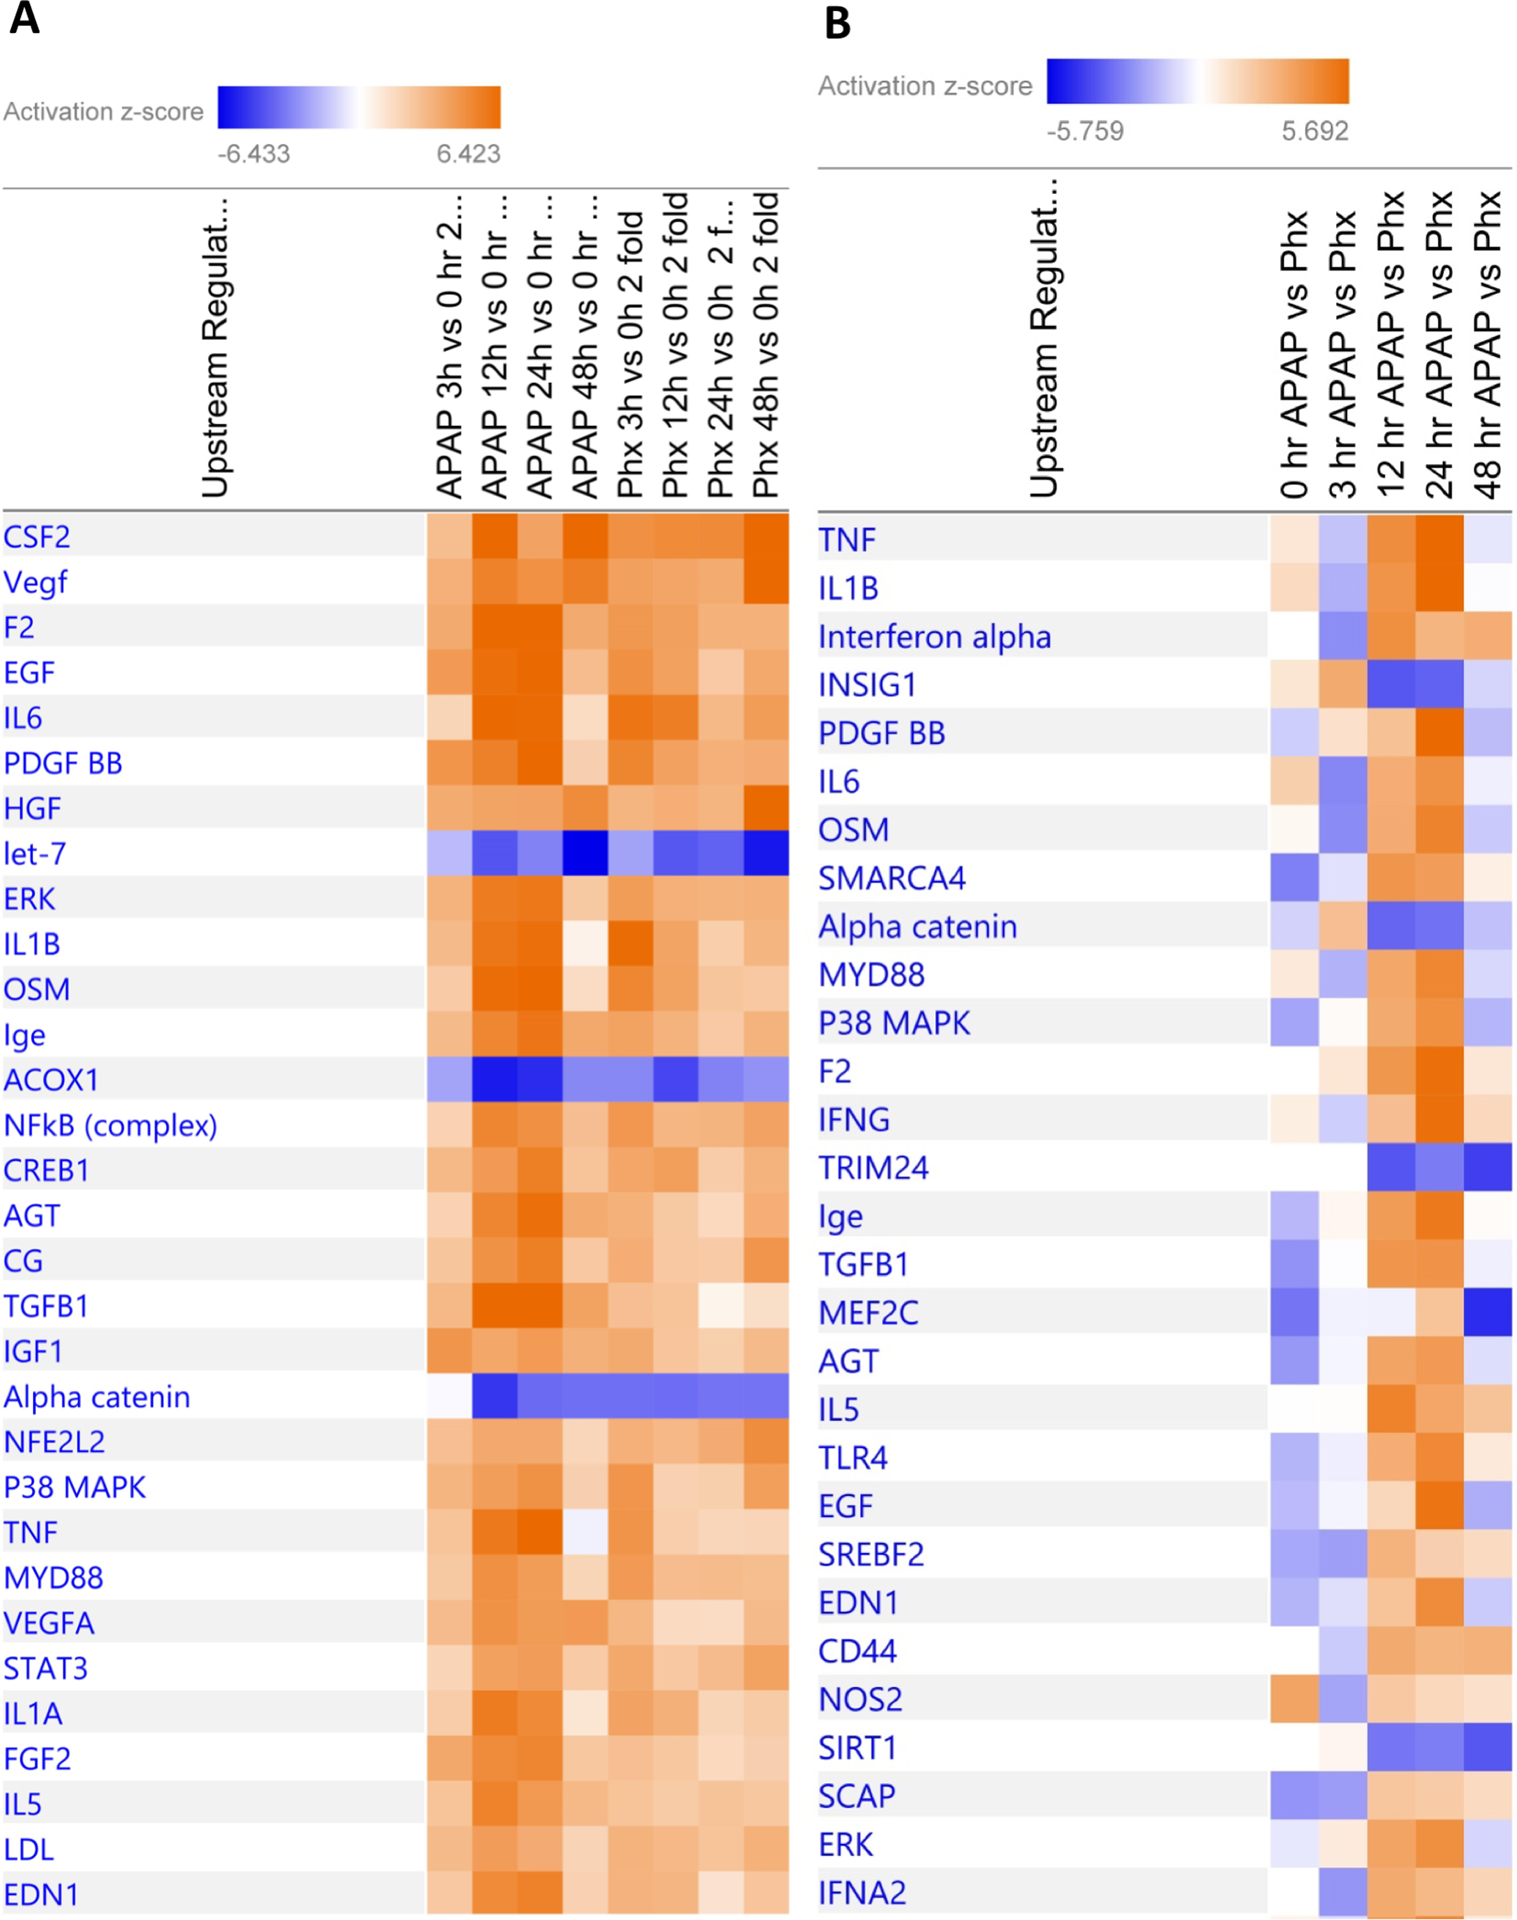
Figure 2.

(A) Heat-map showing comparison of top 30 upstream regulators predicted to be alerted at various time points after APAP300 or PHX compared to basal levels as analyzed using Ingenuity Pathway Analysis (IPA). Genes which were upregulated or downregulated at least 2 fold at various time points (3, 12, 24 and 48 hr) vs 0 hr in APAP300 or PHX group were used for analysis. (B) Heat-map showing comparison of top 30 upstream regulators predicted to be alerted in APAP300 vs PHX group at various time points as analyzed using Ingenuity Pathway Analysis (IPA). Genes which were upregulated or downregulated at least 2 fold in APAP300 vs PHX group at various time points (0, 3, 12, 24 and 48 hr) were used for analysis. Upstream regulators were predicted based on analysis of downstream gene network taking directionality and fold change of each gene into consideration. (Orange: predicted activation; Blue: predicted inhibition; intensity of color reflect z-score value for activation/inhibition)
