
Figure 4. Predicted activation of VEGF signaling after both APAP300 and PHX.
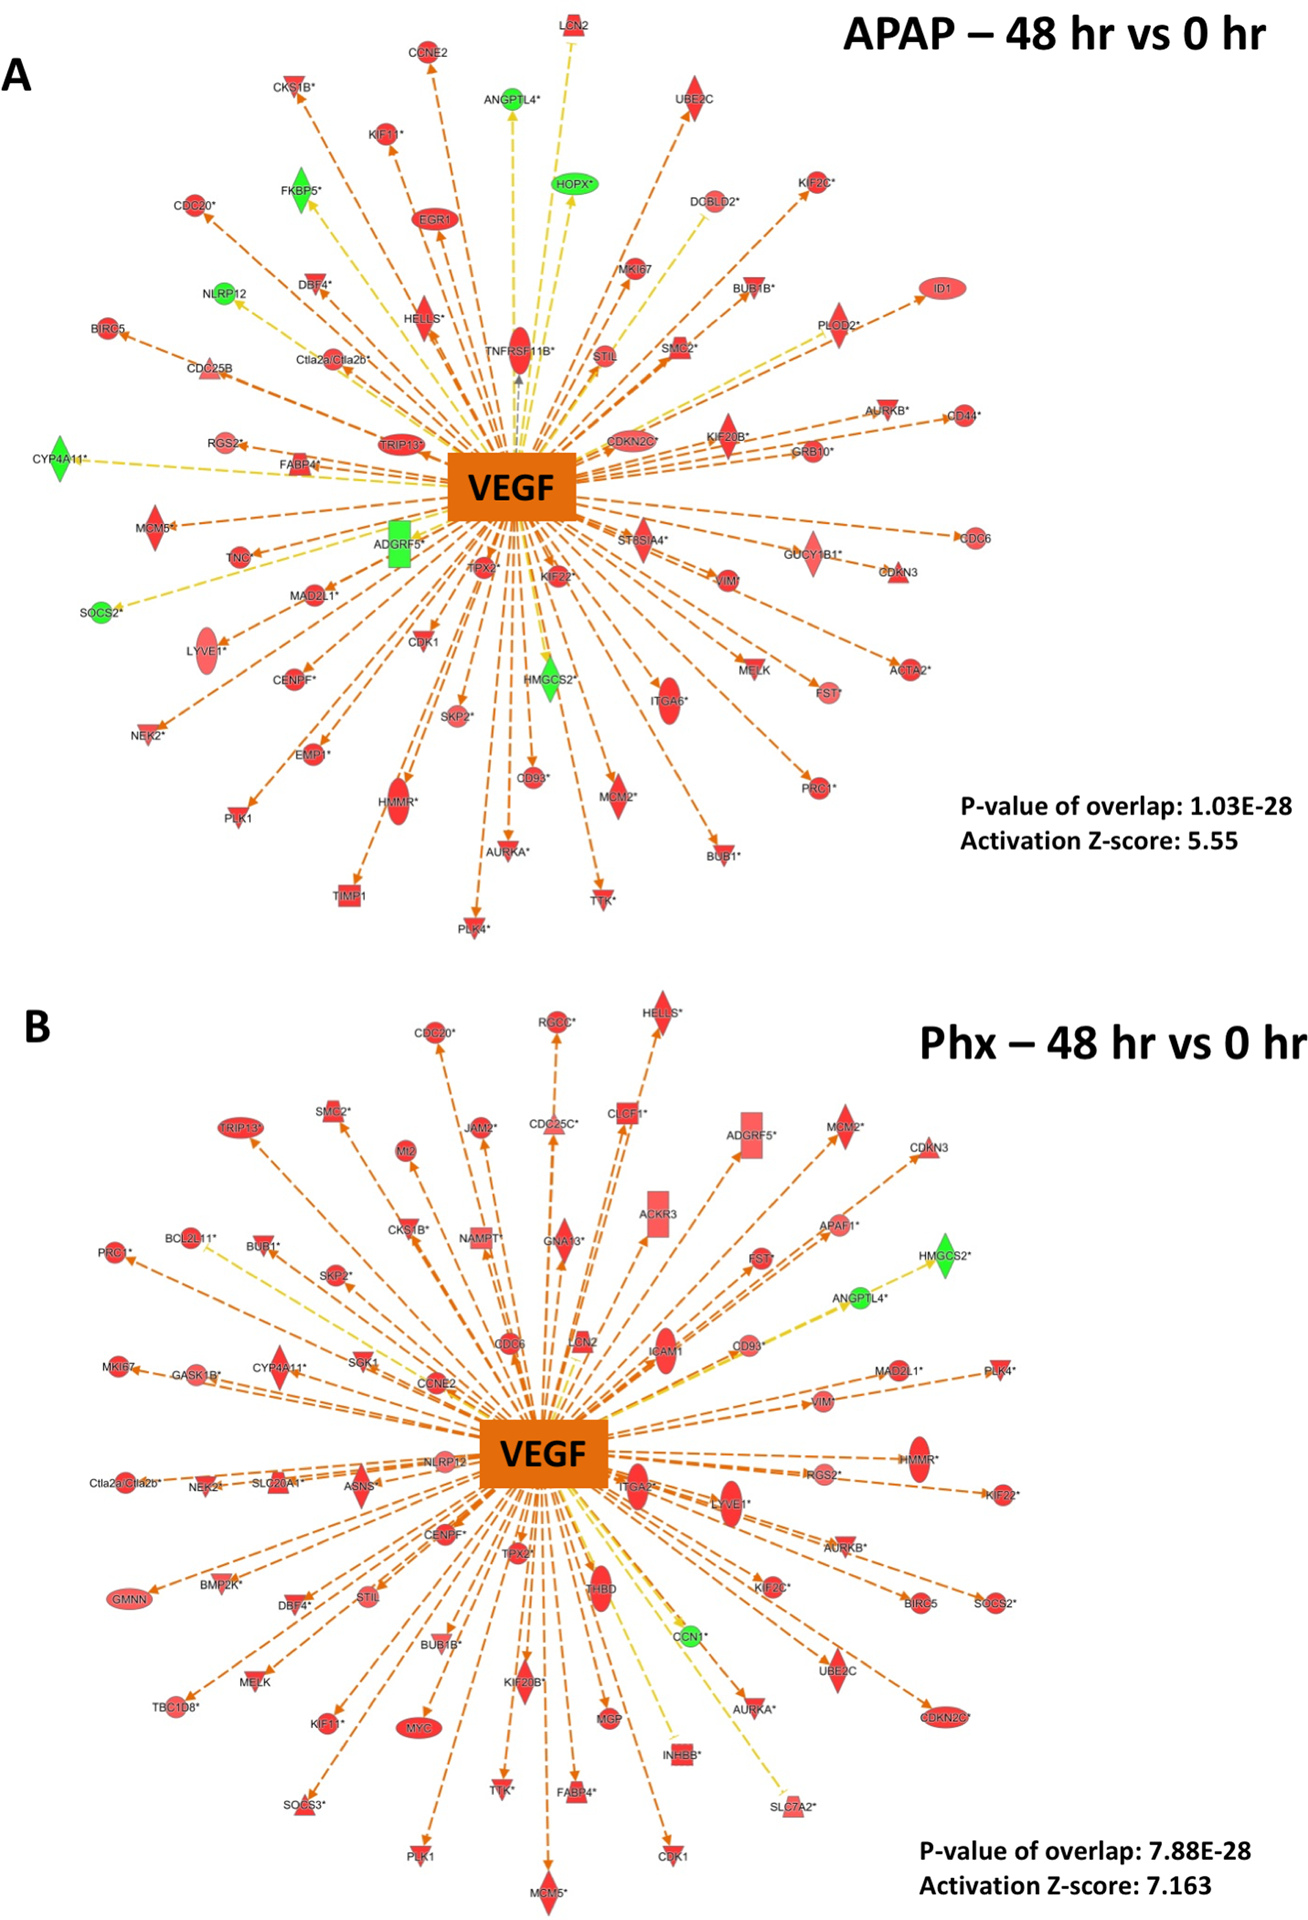
Ingenuity Pathway Analysis (IPA) of microarray data showing predicted activation of VEGF signaling at 48 hr (vs 0 hr) after (A) APAP 300 and (B) PHX, based on downstream gene expression profile. Positive z-score (absolute z-score > 2 considered as significant) represents predicted activation of upstream regulator based on expression profile of downstream genes. p-values signifies extent of overlap between set of downstream target genes of a upstream regulator in dataset compared to all known downstream target genes of that upstream regulator in the reference genome. (red shapes: upregulated genes; green shapes: downregulated genes with intensity of color reflecting extent of upregulation or downregulation; orange center shape: predicted activation)