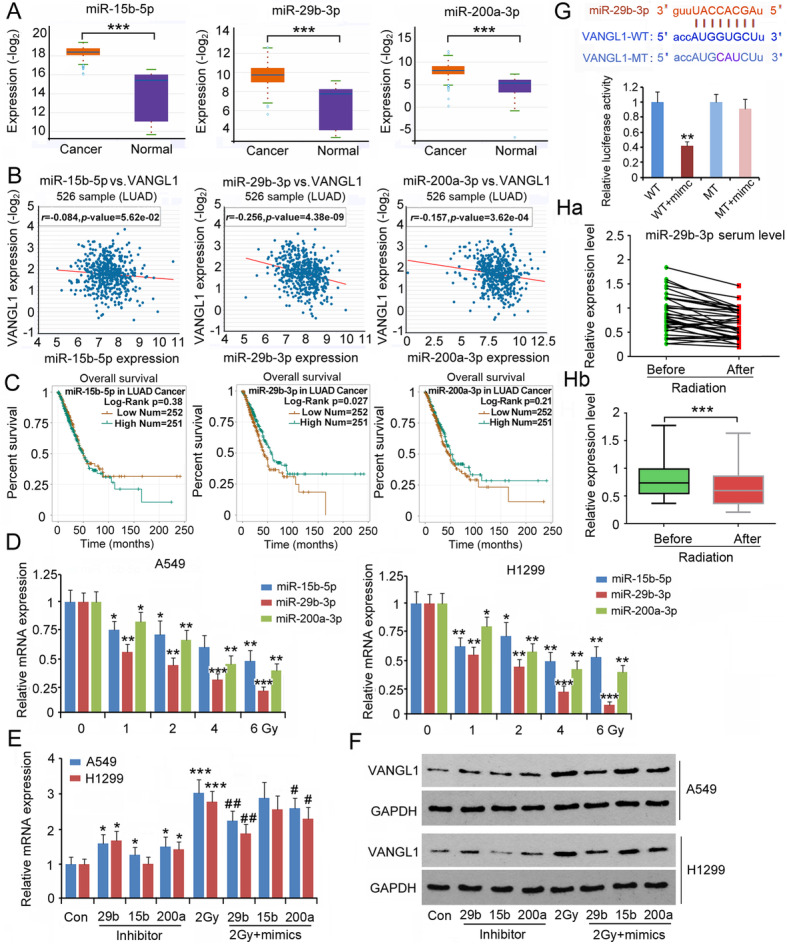
Fig. 6.

miR-29b-3p deficiency was associated with reduced degradation of VANGL1 mRNA. a Starbase web showing miR-15b-5p, miR-29b-3p and miR-200a-3p expression in LUAD and normal lung tissues. ***P < 0.001 vs. normal tissues. Unpaired two-tailed t-tests (n = 526). b Starbase web showing the correlation of VANGL1 expression with miR-15b-5p, miR-29b-3p and miR-200a-3p expression in LUAD. c Gepia web showing the survival time and percentage of survival in LUAD patients with high or low levels of miR-15b-5p, miR-29b-3p and miR-200a-3p. d Expression of miR-15b-5p, miR-29b-3p and miR-200a-3p was tested in LUAD cells after exposing different dosages of irradiation. *P < 0.05, **P < 0.01 and ***P < 0.001 vs. 0 Gy. One-way analysis of variance (ANOVA) with post-hoc Dunnett’s testing (n = 3). LUAD cells were transfected with inhibitors of miR-15b-5p, miR-29b-3p and miR-200a-3p. In addition, LUAD cells were transfected with mimics of these miRNAs, followed by 2 Gy irradiation. After these treatments, cells were subjected to (e) PCR and (f) western blot assays. *P < 0.05, and ***P < 0.001 vs. control group; #P < 0.05, and ##P < 0.01 vs. 2 Gy group. In this group, cells were only treated with 2 Gy irradiation. One-way analysis of variance (ANOVA) with post-hoc Dunnett’s testing (n = 3). g Luciferase report assay was performed to determine whether VANGL1 is a target of miR-29b-3p. **P < 0.01 vs. WT group. Unpaired two-tailed t-tests (n = 3). h The serum level of hsa-miR-29b-3p in patients with LUAD before and after radiotherapy. Ha: the green and red dots represent the serum level of hsa-miR-29b-3p in patients with LUAD before and after radiotherapy, respectively. The green and red dots belonging to the same patient were connected by a line. Hb: the bar chart of hsa-miR-29b-3p serum level. ***P < 0.001 between before and after radiotherapy. Paired two-tailed t-tests (n = 36)
