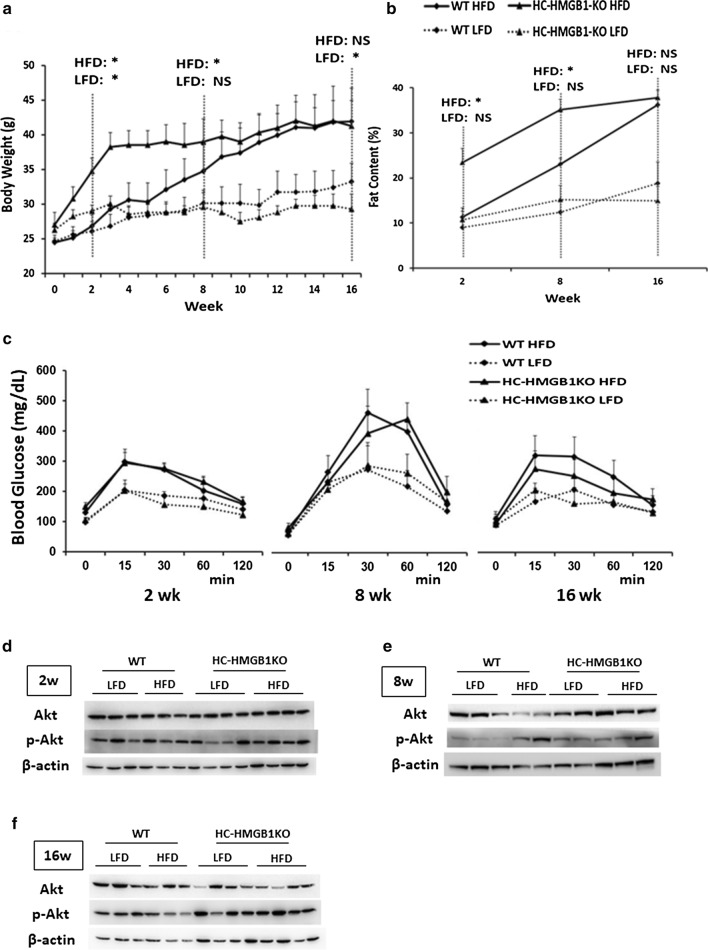
Fig. 2.
Body weight, fat content and glucose metabolism in WT and HC-HMGB1−/− mice up to 16 weeks after LFD or HFD feeding. a Body weight measurements of WT and HC-HMGB1−/− (KO) mice. b Fat content. c Blood glucose tolerance test. *P < 0.05 between WT LFD and KO LFD, or WT HFD and KO HFD groups; NS, not significant. d–f The insulin signaling. Western blot analyses of levels of Akt and p-Akt (insulin signaling markers) in WT and HC-HMGB1−/− (KO) liver at d 2 weeks, e 8 weeks and f 16 weeks after LFD or HFD feeding. Lysates from one mouse liver per lane. Images representative of at least three repeated experiments

