Fig. 3.
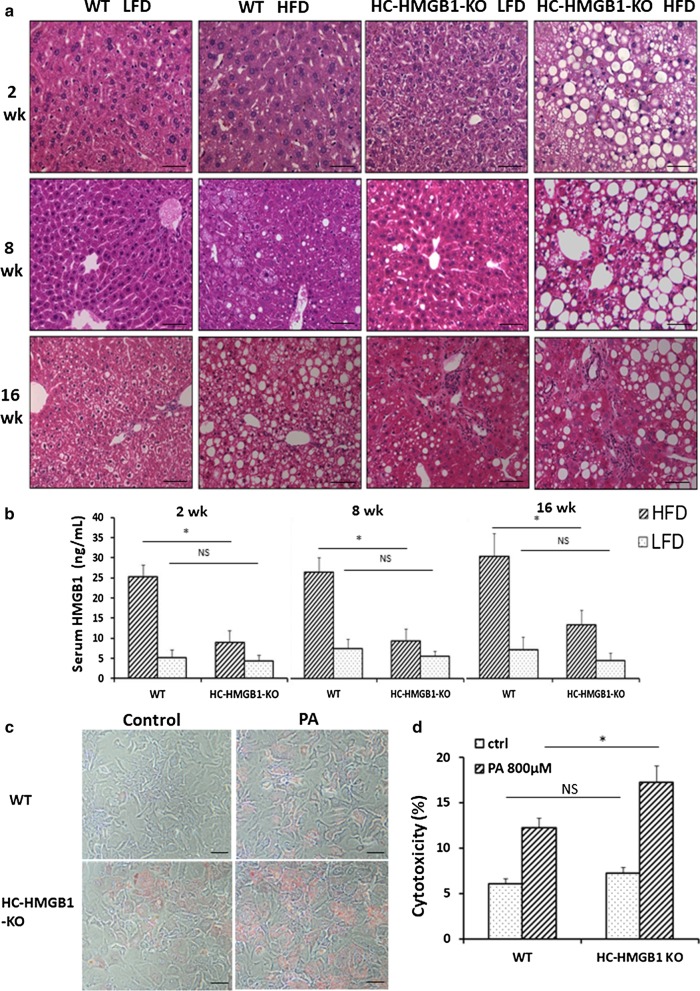
Steatosis, liver injury, inflammation and serum HMGB1 levels in WT and HC-HMGB1−/− mice up to 16 weeks after LFD or HFD feeding. a Representative H&E stained liver sections. n = 4 for each group; × 40 magnification; scale bar, 50 μm. b Levels of serum HMGB1 in mice subjected to LFD or HFD for 2 weeks, 8 weeks and 16 weeks. c Lipid accumulation shown by Oil O Red Staining (red) in WT and HC-HMGB1−/− mouse primary hepatocytes at 24 h after PA (800 μM) treatment. d Hepatocyte cytotoxicity (%) measured by LDH release in vitro after PA (800 μM) treatment for 24 h. Data show mean ± SEM for one experiment performed in triplicate and representative of three separate repeats. *P < 0.05 between indicated groups; NS not significant

