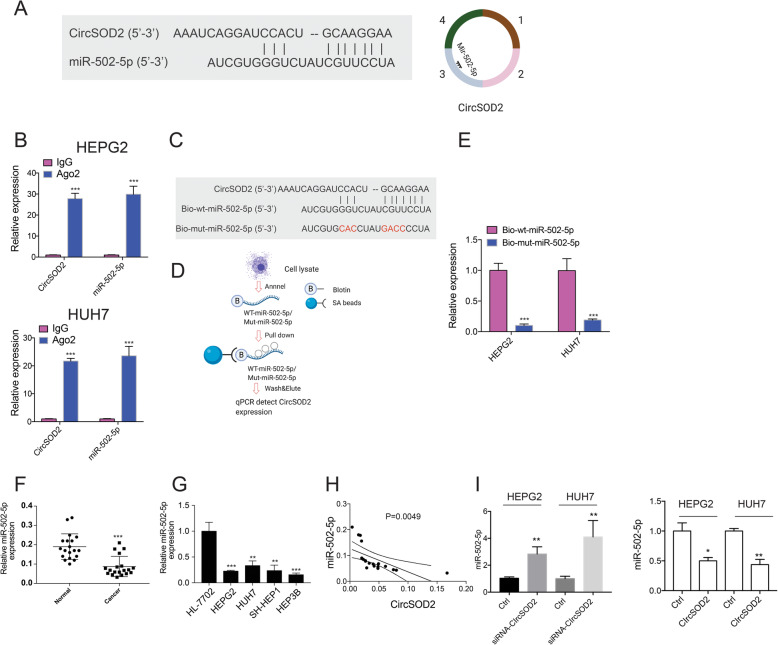
Fig. 4.
CircSOD2 suppress miR-502-5p expression by acting as a sponge. a Diagram of circSOD2 and miR-502-5p interaction sites. b Pull down circSOD2 and miR-502-5p with Ago2, IgG was used as control. c Diagram of biotin labeled wild type miR-502-5p and mutant miR-502-5p. Mutated sites were labeled with red. d Diagram of biotin pull down assay. e Detection of circSOD2 expression after pulling down with biotin labeled wild type miR-502-5p or mutant miR-502-5p. f miR-502-5p expression in 19 HCC patient tumor tissues and adjacent normal liver tissues. g miR-502-5p expression in normal liver cell HL-7702 and liver cancer cell line HEPG2, HUH7, SK-HEP1, and HEP3B. h Correlation analysis of miR-502-5p and circSOD2 in HCC patient tumor tissues. i miR-502-5p expression after silencing or over-expressing circSOD2. *P < 0.05, **P < 0.01, ***P < 0.001

