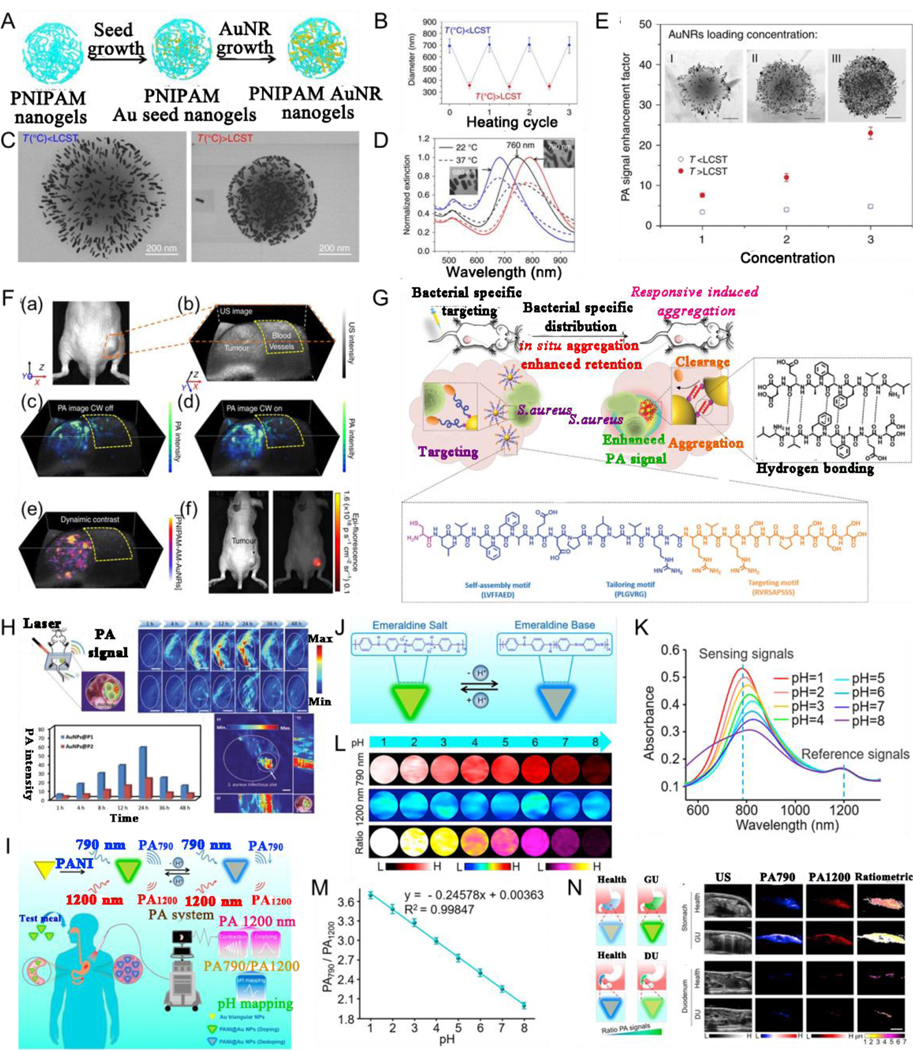
Fig. 14.

(A) Schematic illustration of the PNIPAM-AuNR preparation. (B) Averaged diameter of PNIPAM below and above lower critical solution temperature (LCST). (C) TEM images of PNIPAM-AuNR nanostructures fabricated at temperature below and above LCST. (D) Absorption of PNIPAM-AuNR with different resonance peaks by altering the nanorod aspect ratios. (E) Photoacoustic signal enhancement factor as a function of AuNR loading concentration below and above LCST. (F) In vivo photoacoustic imaging of a tumor-bearing mouse. (a) A photograph of a tumor-bearing mouse. (b) Ultrasound image of the tumor. (c) Photoacoustic image 24 h post-injection exhibits the tumor, and blood vessels near the tumor. (d) Photoacoustic intensity from tumor is enhanced when the continuous-wave laser is on. (e) Dynamic contrast-enhanced PAimaging. (f) In vivo FL imaging 24 h after injection. (G) Schematic illustration of bacterial infection sensing in vivo by AuNP@P1. (H) Photoacoustic imaging of bacterial infection in vivo. (I) Schematic illustration of diagnosis strategy of gastric and intestinal diseases via quantitative PA imaging. (J) Schematic illustrating a pH responsiveness of nanosensor. (K) Different pH’s absorption, and (L) PA imaging of nanosensor, and (M) PA790/PA1200 ratios of nanosensor. (N) Schematic diagram, US imaging, PA imaging at 790 nm, at 1200 nm, and ratiometric PA imaging of stomach or duodenum. (A-F) Reproduced with permission.[221] Copyright 2017, Springer Nature Limited. (G, H) Reproduced with permission.[222] Copyright 2020, WILEY-VCH. (I-N) Reproduced with permission.[236] Copyright 2019, American Chemical Society.
