
Figure 3.
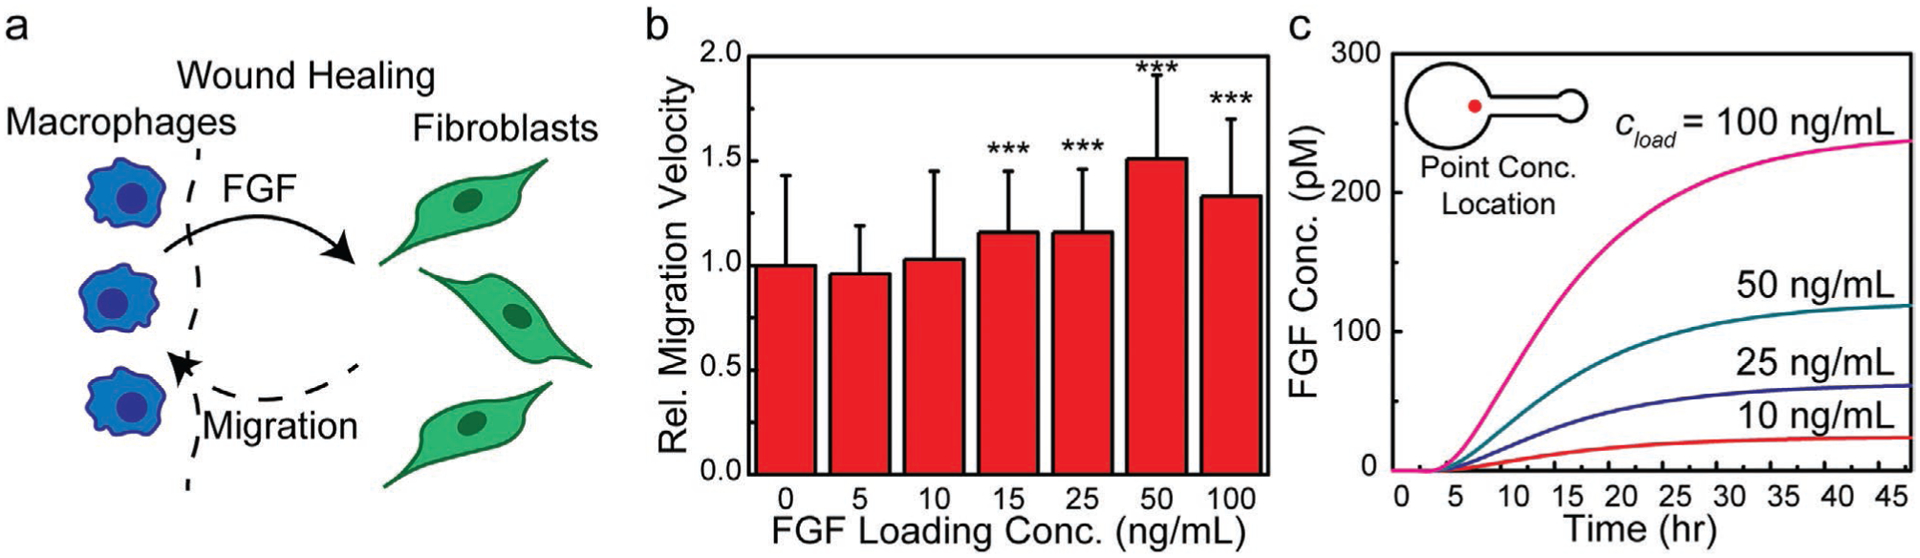
Fibroblast migratory response to a FGF gradient. a) Schematic of fibroblast chemotaxis due to FGF gradients during wound healing. b) Migration velocity relative to the negative control for FGF loading concentrations (cload) of 5, 10, 15, 25, 50, and 100 ng mL−1 showing an optimal concentration at 50 ng mL−1. c) FEA results showing the temporal evolution of the FGF concentration in the cell-seeding chamber (location indicated by the red dot) for FGF loading concentrations of 10, 25, 50, and 100 ng mL−1 (n = 3, Student’s t-test, p-value notation: * = p ≤ 0.05, ** = p ≤ 0.01, *** = p ≤ 0.001).