Fig. 2.
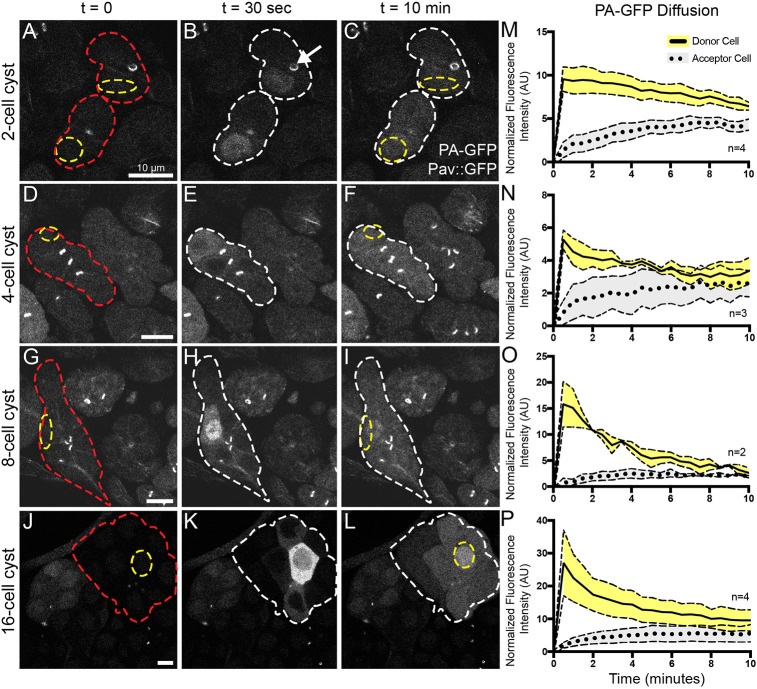
RCs allow movement of GFP between germline cells in a cyst. (A-L) Live imaging of activated PA-GFP at various stages of spermatogenesis reveals sharing of GFP between cells in a cyst (red outline) through the ring canals (marked with Pav::GFP, white arrow). After activation of PA-GFP in a single cell or small region of cells (yellow outline), GFP was found in most of the cells in that cyst after 10 min (white outline). Scale bars: 10 μm. (M-P) Quantification of PA-GFP movement following photoactivation from a single donor cell (solid line) to other cells within the cyst (dashed line represents the fluorescence intensity from an average of all other non-activated cells within the same cyst). Normalized fluorescence intensity (AU) was plotted with respect to time. Error bars represent s.e.m.

