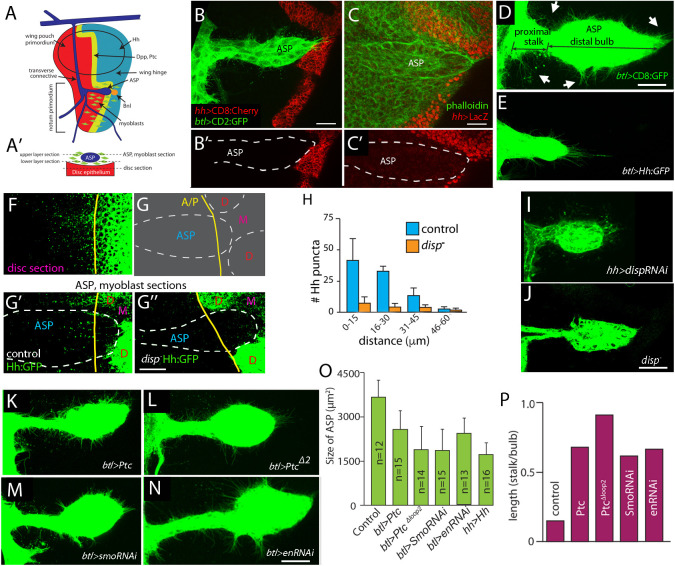
Fig. 1.
Hh signaling in ASP. (A) Schematic indicating wing disc, ASP, myoblasts and dpp-, ptc-, bnl- and hh-expressing cells. (A′) Cross-section showing ASP, myoblasts and disc epithelium; dashed lines, optical sections transecting ASP and disc. (B-C′) ASP outlined by white dashed lines (B′,C′), marked by green fluorescence (btl-lexA>CD2:GFP) (B), Phalloidin (C); hh expression marked by red fluorescence (B,B′, hh-Gal4>CD8:Cherry; (C,C′, hh-lacZ). (D) ASP marked with green fluorescence (btl-Gal4>CD8:GFP); distal bulb, proximal stalk and cytonemes (arrows) indicated. (E) Morphologically abnormal ASP that expressed Hh ectopically (btl-Gal4>Hh:GFP, mCD8:GFP). (F) Hh:GFP expression in notum where ASP overlies. Yellow line, compartment boundary. (G) Schematic of tissues in (G′,G″). D, disc; M, myoblasts; A/P, compartment boundary. (G′,G″) Hh:GFP (green) expressed in disc present also in control (G′) but not disp mutant (G″) ASP (white dashed line). Images: ASP, myoblast section. (H) Plot of fluorescent Hh:GFP puncta as a function of proximal/distal position in control and disp mutants; n=4 each genotype. (I,J) Morphologically abnormal ASP (I) that expressed disp RNAi in posterior compartment (hh-Gal4>dispRNAi) and disp mutant (J). (K-N) Abnormal ASP in genotypes expressing Ptc (K), PtcΔloop2 (L), smo RNAi (M) and en RNAi (N) driven by (btl-Gal4). (O,P) Quantification of size (O) and shape (P; ratio between average stalk and bulb length; n=5-7 each genotype). All differences between control and mutant conditions statistically significant (unpaired two-tailed Student's t-test; P<0.05). Scale bars: 20 μm.

