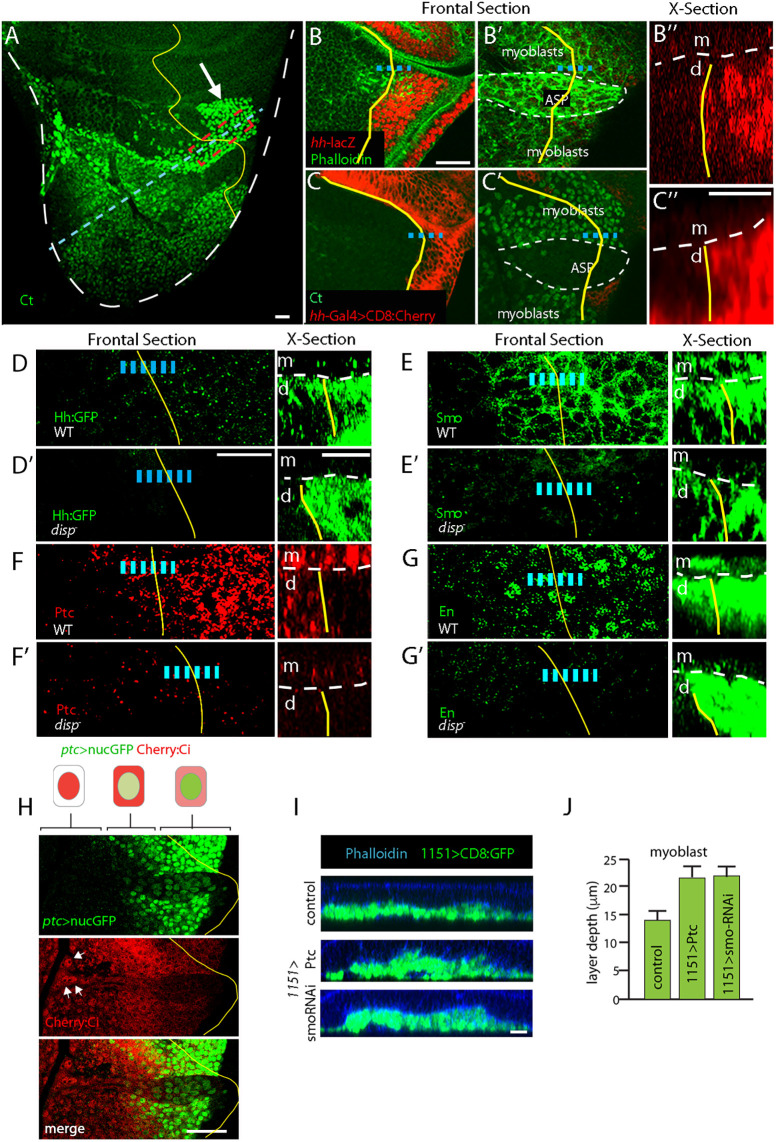
Fig. 4.
Wing disc-derived Hh activates signal transduction in myoblasts. (A) Myoblast α-Ct staining (green) populates notum. White arrow, myoblasts juxtaposed to disc cells expressing hh. (B-C″) hh-lacZ (B, red) and hh-Gal4 (C, red) expression in notum but not in myoblasts or ASP (B′,C′). (D-G′) Hh target gene expression in myoblasts. Hh:GFP fluorescence (D), Smo:GFP fluorescence (E), α-Ptc staining (F) and α-En staining (G) in WT (D,E,F,G) and disp mutants (D′,E′,F′,G′). (H) Images of ASP and myoblast that express ptc>nucGFP (green) and Cherry:Ci (red). Arrows indicate regions of the ASP with nuclear Cherry:Ci localization. Schematics represent cells in regions with different ptc>nucGFP and Cherry:Ci subcellular distributions. Dashed lines (B″,C″,D-G′ X-sections) show boundary between myoblasts (m) and disc cells (d). Yellow line (A-H) indicates A/P compartment border; blue dashed line shows the region imaged in cross section. In D-G′, Hh targets analyzed in red-boxed region shown in A. Cells along dashed blue line imaged in I. (I) Orthogonal sections of control (1151-Gal4>+), Ptc overexpression (1151-Gal4, UAS-Ptc) and smo RNAi expression (1151-Gal4, UAS-smoRNAi). Disc cells visible by Phalloidin staining (blue); layers of myoblasts visible by fluorescence of CD8:GFP (1151-Gal4, UAS-CD8:GFP). (J) Depth of the myoblast layers for genotypes shown in I. Difference between control, Ptc overexpression and smo RNAi expression, statistically significant (unpaired two-tailed Student's t-test, P<0.05). n=5 for each genotype. Scale bars: 20 μm (A-C′,D′,E-I); 10 μm (C″,D′, X-section).

