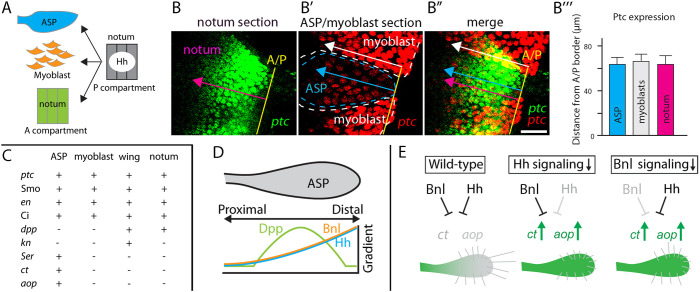
Fig. 9.
Hh signals to multiple targets. (A) Hh from disc signals to notum cells, myoblasts and ASP. (B-B″) ptc-expressing cells in disc, ASP and myoblast, detected by the fluorescence of ptc-nuclear GFP in two optical sections. GFP fluorescence is green in notum section, red in ASP/myoblast section. Yellow line, A/P compartment border. Extent of ptc expression in the anterior compartment, ASP and myoblast marked by magenta, blue and white arrows, respectively. (B‴) Ptc expression extent from the A/P border in the ASP, myoblasts and notum. n=7. (C) Transcriptional targets of Hh signaling in myoblast, ASP, wing and notum. (D) Distributions of Dpp, Bnl and Hh taken up in the ASP. (E) Cartoon depicting roles of Bnl and Hh regulating expression of ct and aop (green) in ASP of wild-type and mutant genotypes that decrease Hh or Bnl signaling. Cytoneme lengths decrease with reduction in either Hh or Bnl signaling. Scale bar: 25 μm.

