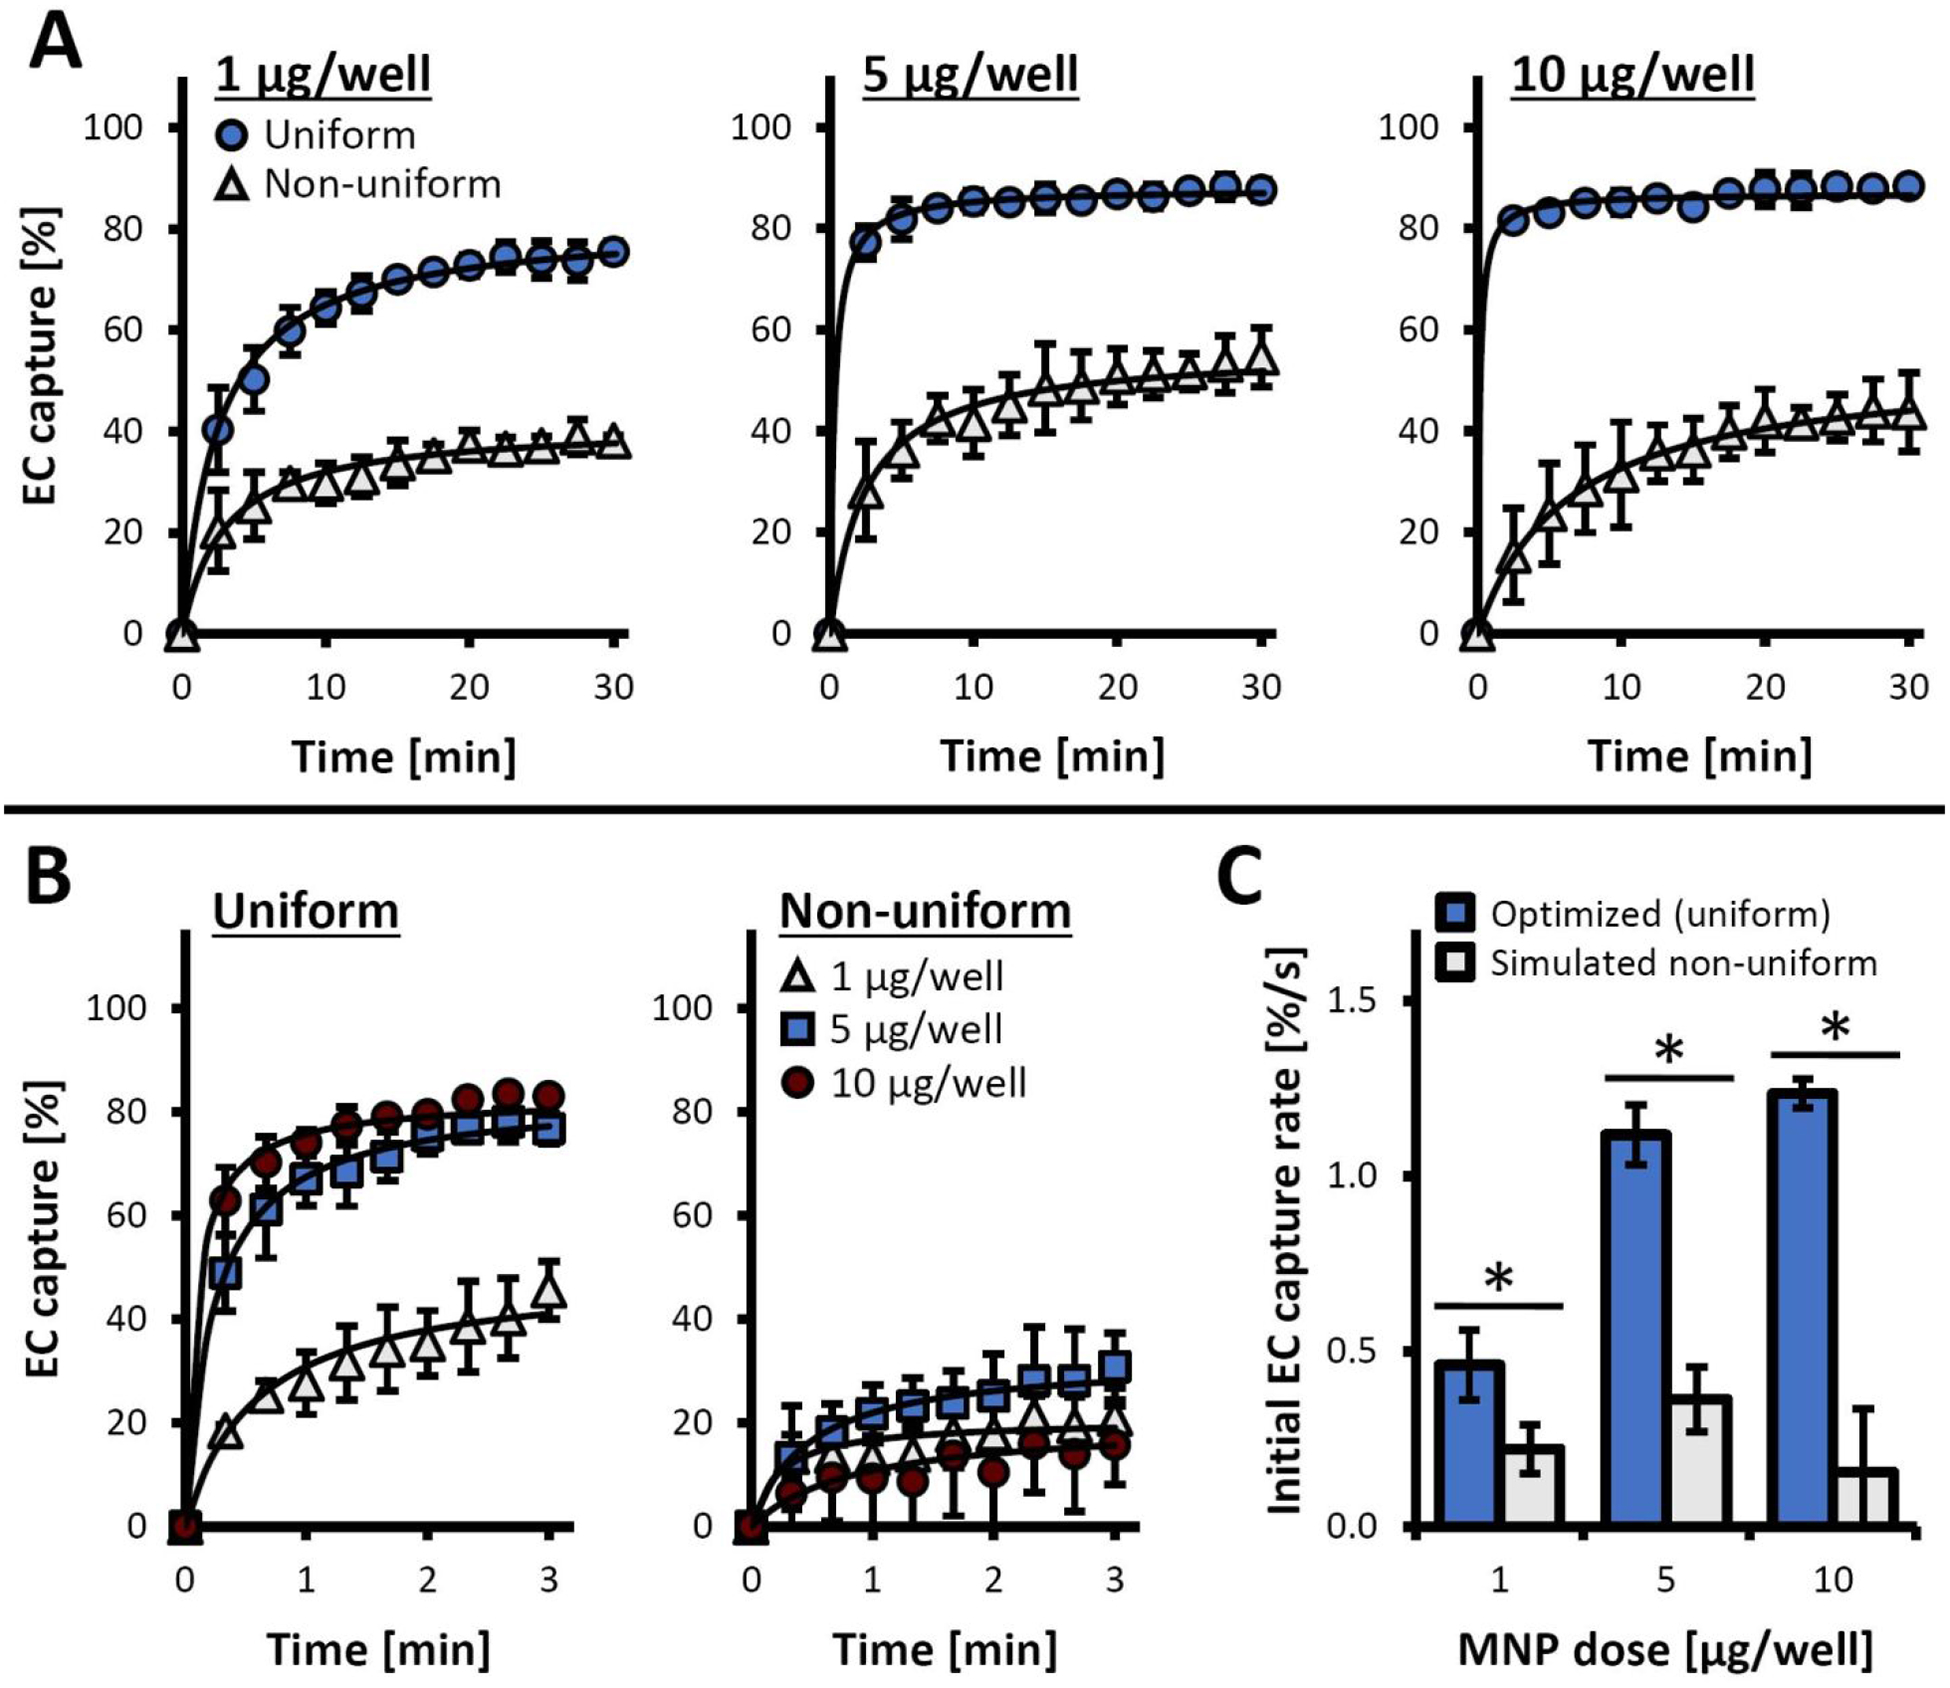
Figure 5.

EC capture using a depletion-based magnetophoresis assay. MNP-loaded EC were labeled with 3,3-dioctadecyloxacarbocyanine perchlorate and the fluorescence intensity of the EC suspensions were monitored longitudinally (λex/λem = 485 nm/535 nm) during exposure to a high-gradient magnetic field. (A) The time courses of fluorescence intensity changes are shown for EC loaded using 1, 5, and 10 μg MNP/well using the optimized (uniform) vs. simulated non-uniform loading procedures. Data are presented as normalized fluorescence intensities normalized to initial values (It/I0). (B) The time course of cell capture shown in detail for the initial 3 min of the capture experiment: a comparison between EC loaded uniformly vs. non-uniformly with 1, 5, and 10 μg MNP/well. (C) Initial kinetics of cell capture (measured over the first minute), presented as fractional cell depletion per second for EC loaded uniformly vs. non-uniformly with 1, 5, and 10 μg MNP/well. An * denotes a statistically significant difference between the optimized (uniform) loading and the simulated, non-uniform loading procedures at a given MNP dose.
