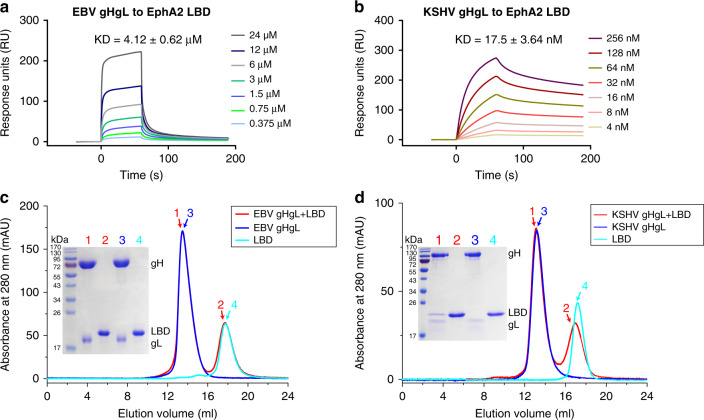
Fig. 1. EBV gHgL binds to the LBD of EphA2 with much lower affinity than KSHV gHgL.
a, b The binding affinity of EBV gHgL to LBD (a) and KSHV gHgL to LBD (b), as measured using SPR. EphA2 LBD was immobilized to chip CM5 and the binding affinities of various concentrations of EBV gHgL or KSHV gHgL were tested. The kinetic profiles are shown. KD values shown are the mean ± SEM of three independent experiments. The binding profiles were plotted by GraphPad Prism 8.0. c Analytical gel-filtration analyses of EBV gHgL–LBD (red), EBV gHgL (blue), and LBD (cyan) as measured using calibrated Superdex® 200 Increase 10/300 GL columns (GE Healthcare). The chromatographs and SDS-PAGE profiles for each pooled sample (peaks 1–4) are shown. The SDS-PAGE results showed peak 1 contains only EBV gHgL proteins, indicating EBV gHgL and LBD proteins did not form a complex in the gel-filtration assays. d Analytical gel-filtration analyses of KSHV gHgL–LBD (red), KSHV gHgL (blue), and LBD (cyan) as measured using calibrated Superdex® 200 Increase 10/300 GL columns (GE Healthcare). The SDS-PAGE results showed peak 1 contains both KSHV gHgL and LBD proteins, indicating these two proteins could form a complex in the gel-filtration assays. The gel-filtration chromatographs were plotted by OriginPro 8.5. Experiments have been repeated twice and similar results were observed. Source data are provided as a Source Data file.

