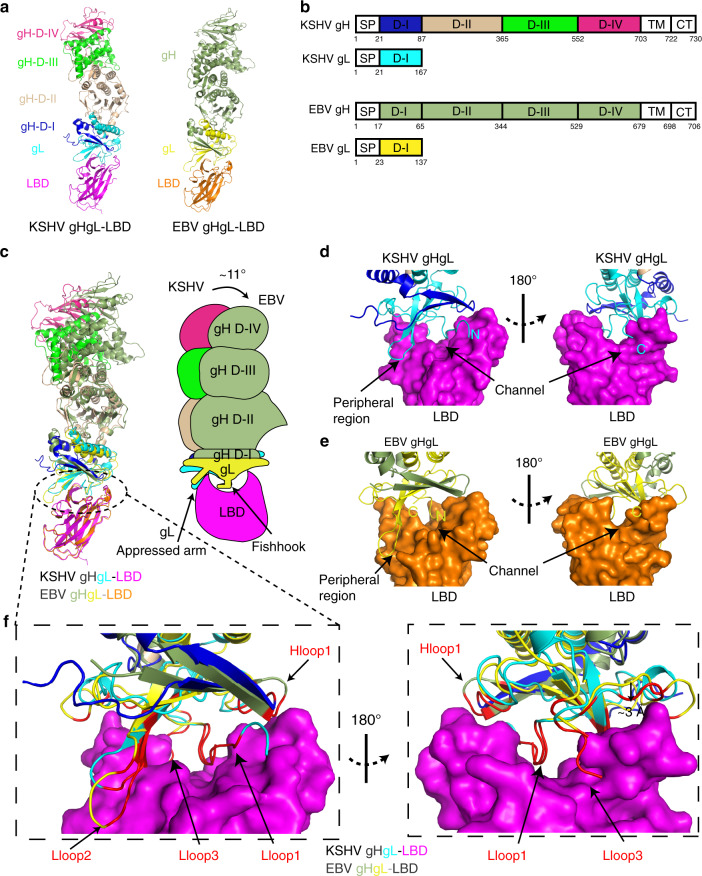
Fig. 2. The overall structures of KSHV gHgL–LBD and EBV gHgL–LBD.
a Cartoon structural representations of KSHV gHgL–LBD and EBV gHgL–LBD. KSHV gH is colored blue in D-I, wheat in D-II, green in D-III, and hotpink in D-IV. EBV gH is colored smudge. KSHV and EBV gL proteins are colored cyan and yellow, respectively. The LBDs of KSHV gHgL–LBD and EBV gHgL–LBD are colored magenta and orange, respectively. b Schematic representation of the KSHV gHgL and EBV gHgL. CT: C-terminal cytoplasmic tail domain, SP: signal peptide, TM: transmembrane. Different colored regions of KSHV gHgL correspond to the different structural domains shown in Fig. 2a. c Superimposition of KSHV gHgL–LBD and EBV gHgL–LBD. KSHV gHgL–LBD and EBV gHgL–LBD are colored as in Fig. 2a. Cartoon diagrams and binding mode pattern are shown. The shift angle and two binding regions of gL to LBD are shown. gL binds to LBD like a fishhook and appressed arm. d, e Binding mode of KSHV gHgL (d) and EBV gHgL (e) to LBD. The surface of LBD is shown, and the channel and peripheral regions of LBD are labeled. The N and C termini of gL are labeled N and C, respectively. f Comparison of the LBD-binding interfaces between KSHV gHgL and EBV gHgL. KSHV gHgL–LBD and EBV gHgL–LBD are colored as in Fig. 2a. The surface of LBD is shown. The LBD-binding residues of KSHV gHgL and EBV gHgL are colored red. The Hloop1, Lloop1–3, and β2 regions of KSHV gHgL are displayed.

