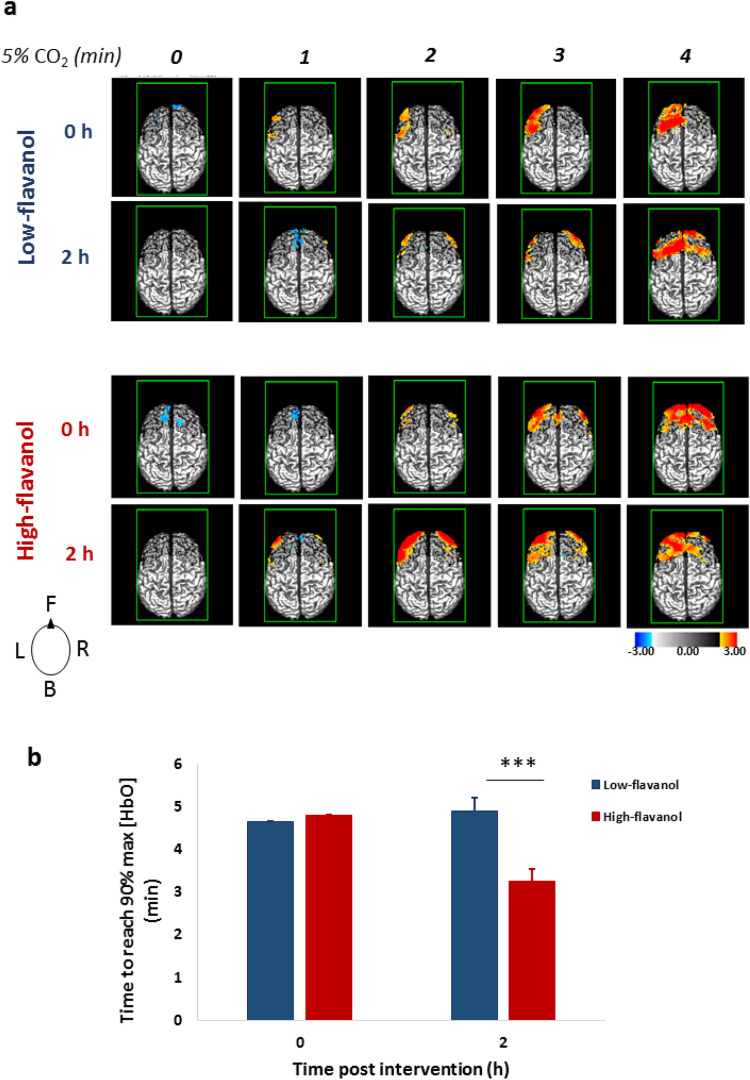
Figure 2.
Brain maps of oxygenated haemoglobin during hypercapnia (5% CO2) both before (0 h) and after (2 h) intake of either a low- or high-flavanol dietary intervention. (a) Oxy-haemoglobin concentration changes (in z scores) across frontal cortical regions and averaged across participants (N = 17) are presented at the time of onset (0 h) and 1, 2, 3, and 4 min into the CO2 challenge. Brain maps, viewed from the top, are oriented as indicated in the inset diagram: F = front, B = back, L = left, R = right; Darker grey background color indicates the recording area. (b) Latency to reach 90% maximal blood oxygenation was significantly lower (***p < 0.001) by approximately 1 min after the high-flavanol intervention in comparison to low-flavanol (Mean ± SEM).

