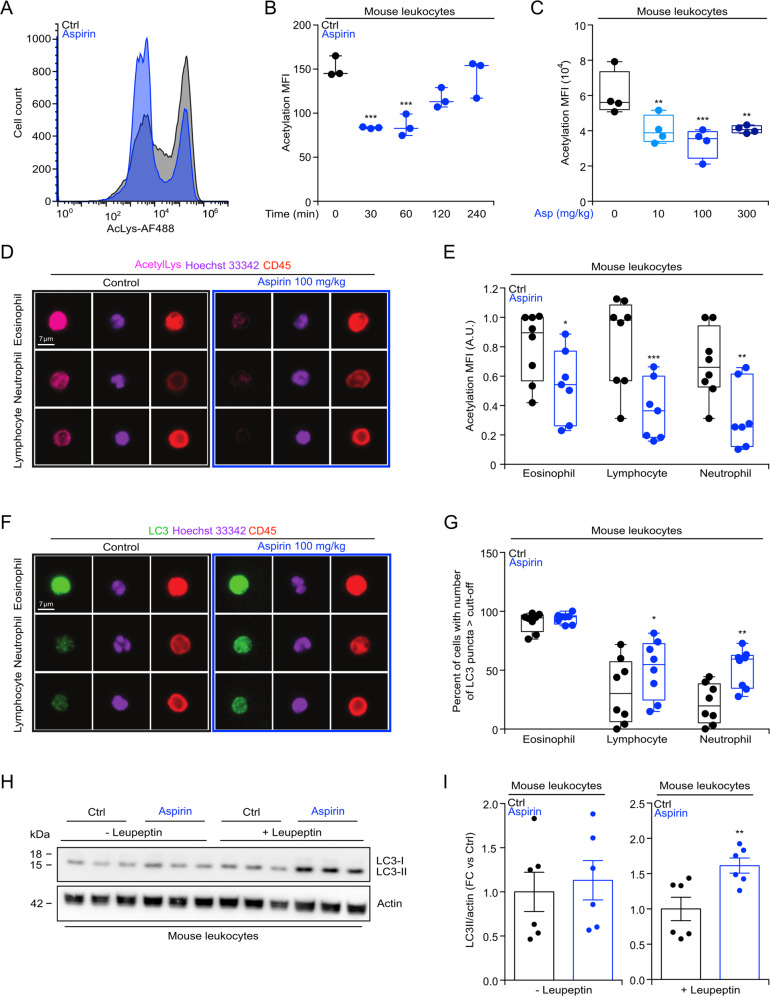
Fig. 2. Aspirin mediated protein deacetylation and autophagy induction in mouse leukocytes.
a–c WT male mice (7 weeks old) received intraperitoneally (i.p.) injections of aspirin (100 mg/kg) and blood was collected at different time points (30, 60, 120, and 240 min post aspirin administration) (b), or mice were treated with different dose of aspirin (10, 100, or 300 mg/kg i.p. administration) and blood collected after 1 h (c), to determine the level of Nε lysine acetylation (representative image in (a), quantification in (b, c) (n = 3/4 mice/group). d–g WT male mice were treated with aspirin (i.p. 100 mg/kg) and 6 h later, the level of Nε lysine acetylation (representative image in (d), quantification in (e) (Ctrl = 8 mice, aspirin = 7 mice) and autophagy induction, measured by counting the number of LC3B puncta per cell, in mice treated 2 h before the recovery of blood with leupeptin (i.p., 15 mg/kg), (representative image in (f), quantification in (g)) (n = 8 mice/group), were determined by immunofluorescence staining in the different leukocytes populations. h, i In the same experimental conditions described in (d–g), the autophagy associated level of LC3 lipidation was evaluated in the absence or presence of leupeptin (i.p., 15 mg/kg) administered 2 h before the recovery of blood (representative blots in (h), quantitation in (I)) (n = 3 mice/group, 2 independent experiments). In this figure, data are displayed as box and whisker plots, which show median, first and third quartiles, and maximum and minimum values (b, c, e, g) or as scatter dot plot as mean ± s.e.m. i Circles, in the graphs, indicate each mouse used in the experiment. Statistical comparisons were done by one-way ANOVA (b, c), two-way ANOVA (e, g) and two-tailed unpaired Student’s t test (i) comparing aspirin-treated to untreated mice (*p < 0.05, **p < 0.01, ***p < 0.001). A.U arbitrary unit, Ctrl control, FC fold change, MFI mean fluorescence intensity, min minute.

