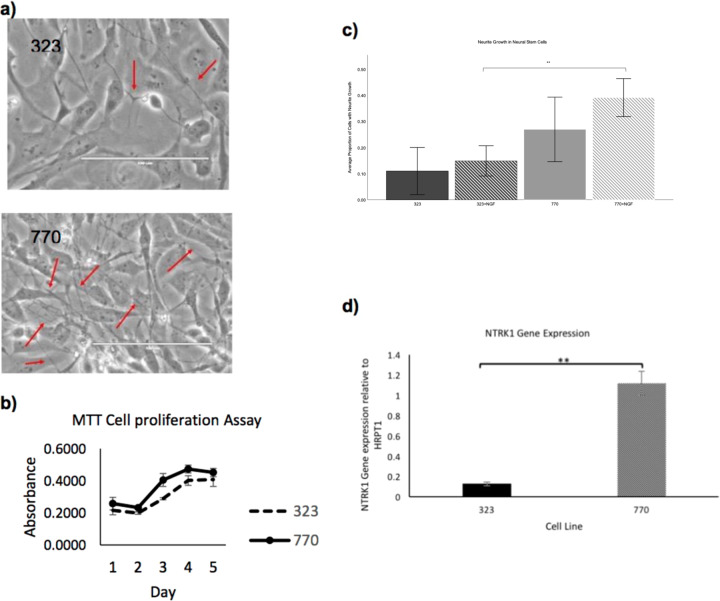
Fig. 2. Functional analysis using neural stem cells.
a NSC line morphology of E492K mutant line (323) and control line (770) with red arrows indicating neurite growth. NSC line 770 also appears to have denser growth of cells and more neurite outgrowth. b Cell proliferation measured by absorbance of formazan in NSC lines. (n = 3). c Proportion of neural stem cells in a given field with at least one neurite outgrowth with or without NGF treatment. Control cell line (770) has a significantly higher (One way ANOVA; n = 12, **p < 0.01) proportion of cells with neurite outgrowth when treated with NGF. d NTRK1 expression of NSCs. NTRK1 expression of the control cell line, 770, is significantly different (Independent T-test; **p < 0.01) when compared to the mutant cell line, 323.

