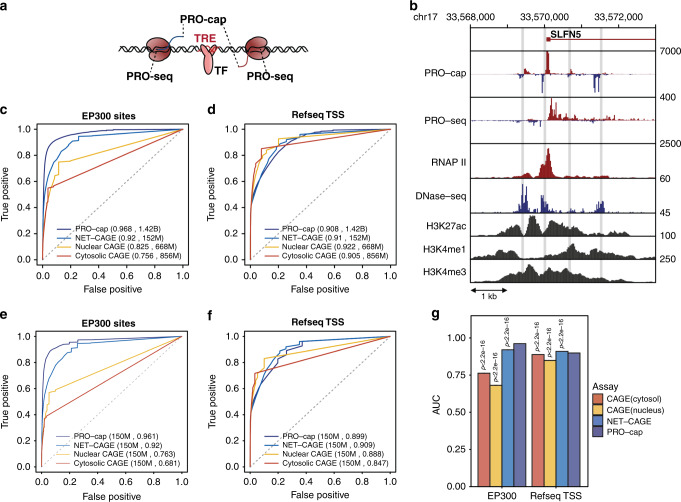
Fig. 1. PRO-cap identifies tTREs with high resolution and sensitivity.
a Schematic of bidirectional transcription at tTREs. PRO-cap measures nascent-capped-RNA levels and identifies the precise TSS positions (5′ end); PRO-seq measures the 3′ end of RNAs associated with transcriptionally-engaged polymerase. b Transcription and chromatin marks at the SLFN5 locus. PRO-cap, PRO-seq, and DNase-seq data are derived from the YRI LCLs, RNAP II, H3K27, H3K4me2 and H3K4me3 ChIP-seq data are from ENCODE’s LCL, GM12878. Shaded regions indicate PRO-cap-identified tTREs. c Receiver operating characteristic (ROC) plots of PRO-cap, CAGE from nuclear and cytoplasmic poly-A selected RNA, and NET-CAGE at EP300 bound enhancers (n = 18,956). Each profile comes from an aggregate of all replicates. NET-CAGE data is for GM12878 and CAGE data is from ENCODE Riken GM12878. d As in c for annotated gene promoters (n = 12,272). e As in c, except using downsampling of aggregate datasets to match read counts to 150 million reads per method (n = 20 for each dataset). f As in e for annotated gene promoters. g Mean area under ROC curves (e and f, n = 20 downsamplings for each dataset). P-values for all tests compared to PRO-cap are by two-sided Welch t-test for the mean AUC for EP300 sites and Refseq promoters. Source data are provided as a Source Data file.

