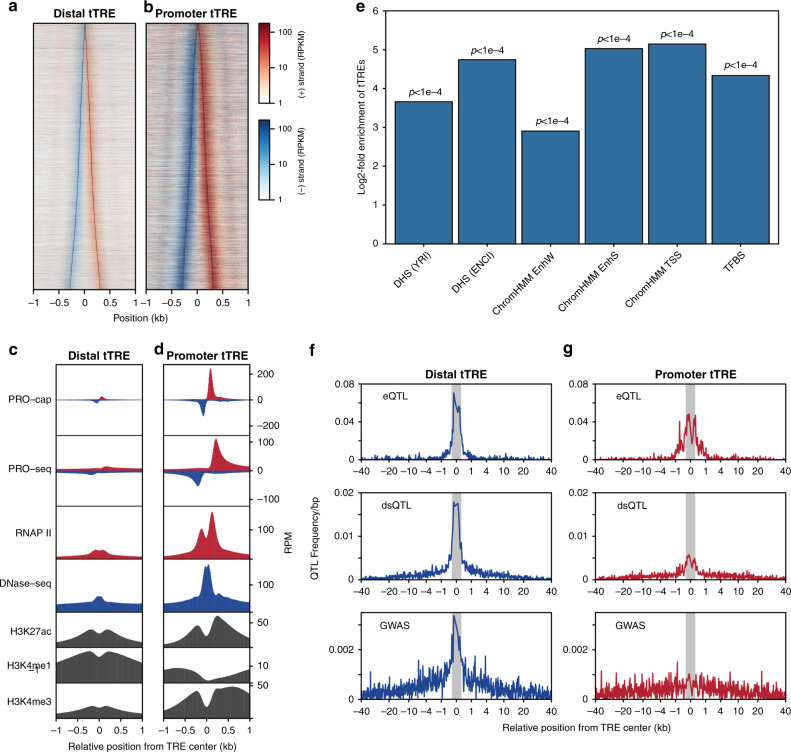
Fig. 2. tTREs contain important regulatory information.
a PRO-cap signal at enhancers. Heatmap shows plus-strand (red) and minus-strand (blue) read counts at distal tTREs (putative enhancers), ordered by increasing width. b As in a at promoter tTREs. c PRO-cap-identified tTREs have characteristic promoter and enhancer chromatin patterns. Metaplots of PRO-cap, PRO-seq, DNase-seq and RNAP II, H3K27ac, H3K4me1, and H3K4me3 ChIP-seq signals at enhancers (Distal tTRE). d As in c at promoter tTREs. Promoters are oriented in the direction of the gene. e Enrichment of tTREs in regulatory regions. DHS (YRI): DNase I hypersensitive windows from the Yoruba LCLs (n = 630,168), DHS(ENC): DNase I hypersensitive sites from ENCODE LCLs (including GM12878; n = 359,361), TFBS: defined by ENCODE Factorbook in GM12878 (n = 212,144). ChromHMM: regions defined by ChromHMM as weak enhancers (EnhW; n = 70,620), strong enhancers (EnhS; n = 19,362), and transcription start sites (TSS; n = 21,342) in GM12878. GAT computes an empirical, one-sided p-value defined as the number of sampled segments that show an equal or greater overlap than the observed overlap. P-values are adjusted by Benjamini-Hochberg correction, sampling n = 10,000. f Frequency of genetic variants associated with gene expression (eQTLs), chromatin accessibility (dsQTLs), and human disease (GWAS) at enhancer tTREs. Both the eQTLs and dsQTLs are derived from the same set of LCLs used in this paper. Shaded regions indicate tTRE boundaries. g As in f at promoter tTREs.

