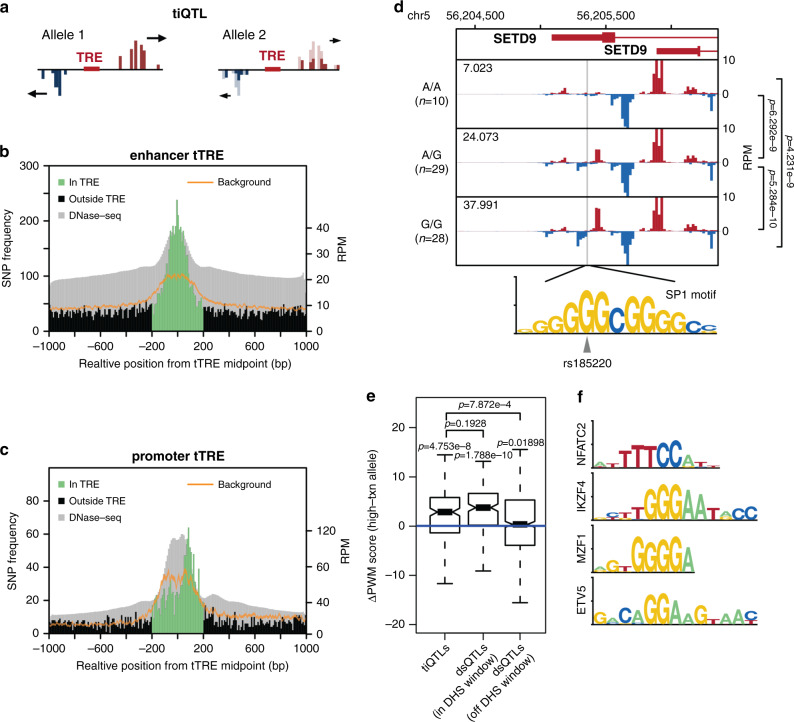
Fig. 3. Transcription initiation QTLs are enriched in tTREs and affect TFBS motifs.
a Transcription initiation QTL (tiQTL) schematic. b tiQTLs are enriched at enhancer midpoints. A histogram of QTL frequency around enhancer midpoints with the expected background distribution with 99% confidence interval (sampled from all SNPs in the same region) shown in orange and aggregate DNase-seq track shown in gray. c tiQTLs are enriched at promoter TSSs. As in b, at promoters except oriented so that the strand with the dominantly transcribed TSS (usually gene) is downstream of tTRE center. d Average PRO-cap signal separated by genotype at tiQTL rs185220. The alternate allele creates a perfect match to the SP1 binding motif. Mean normalized transcription initiation levels for each genotype indicated in the upper left corner. Comparison of transcription initiation index between groups using two-sided Wilcoxon test. Exact p-values are p = 6.3 × 10⁹ between A/A and A/G, p = 5.3 × 10⁻¹⁰ between A/G and G/G, and p = 4.2 × 10⁻⁹ between A/A and G/G. e Difference in PWM scores between tiQTL high transcription and low transcription alleles with effect size not equal to zero. Center line of boxplot indicates the median, box limits are the 25th and 75th quantiles, whiskers are the 1.5x interquartile range, and the notch reflects the 95% confidence interval of the median. DNase hypersensitivity QTLs are shown for comparison. P-values above each group are single sample two-sided Wilcoxon tests. Exact p-values are p = 4.8 × 10⁻⁸, p = 1.8 × 10⁻¹⁰, and p = 0.019. P-values between groups are two-sided Wilcoxon tests. Exact p values are p = 7.9 × 10⁻⁴ between tiQTLs and off window dsQTLs and p = 0.19 between tiQTLs and in window dsQTLs. (n = 215, 815, and 603 QTLs respectively). f Motifs most often affected by in-tTRE tiQTLs (>20% increase over background).

