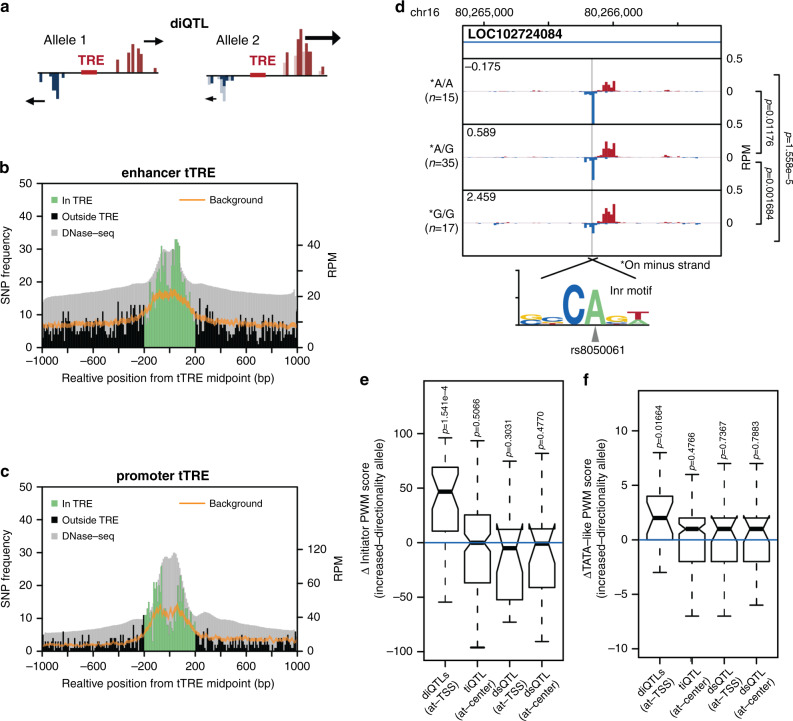
Fig. 4. Directional initiation QTLs are enriched at TSSs and affect core promoter elements.
a Directional initiation QTL (diQTL) schematic. b diQTLs are enriched at enhancer TSSs. A histogram of QTL frequency around enhancer midpoints with the expected background distribution with 99% confidence interval (sampled from all SNPs in the same region) shown in orange and aggregate DNase-seq track shown in gray. c diQTLs are enriched at promoter TSSs. As in b, at promoters except oriented so that the strand with dominantly transcribed TSS is downstream of the TRE center. d Average PRO-cap signal separated by genotype at diQTL rs8050061. The alternate allele disrupts a canonical human Inr motif. Mean directionality index of each genotype indicated in the upper left corner. Comparison of directionality index between groups using two-sided Wilcoxon text. Exact p-values are p = 0.012 between A/A and A/G, p = 0.0017 between A/G and G/G, and p = 1.6 × 10⁻⁵ between A/A and A/G. e Difference in Inr PWM score with effect size not equal to zero between increased and decreased directionality allele for diQTLs within 10 bp from the TSSs (at-TSS), with tiQTLs within 10 bp from the tTRE center (at-center) and dsQTLs within 10 bp from either TSS or center included for comparison. Center line of the boxplot indicates the median, box limits are the 25th and 75th quantiles, whiskers are the 1.5 × interquartile range, and the notch reflects the 95% confidence interval for the median. Exact p-values are 1.5 × 10⁻⁴, p = 0.51, p = 0.30, and p = 0.48 respectively. (n = 19, 192, 28, and 27 QTLs respectively). f As in e, for TATA-box. Here (at-TSS) indicates 40 to 20 bp upstream of TSS, where TATA-box is usually found. Exact p-values are 0.017, p = 0.48, p = 0.74, and p = 0.79 respectively. (n = 34, 152, 21, and 22 QTLs respectively).

