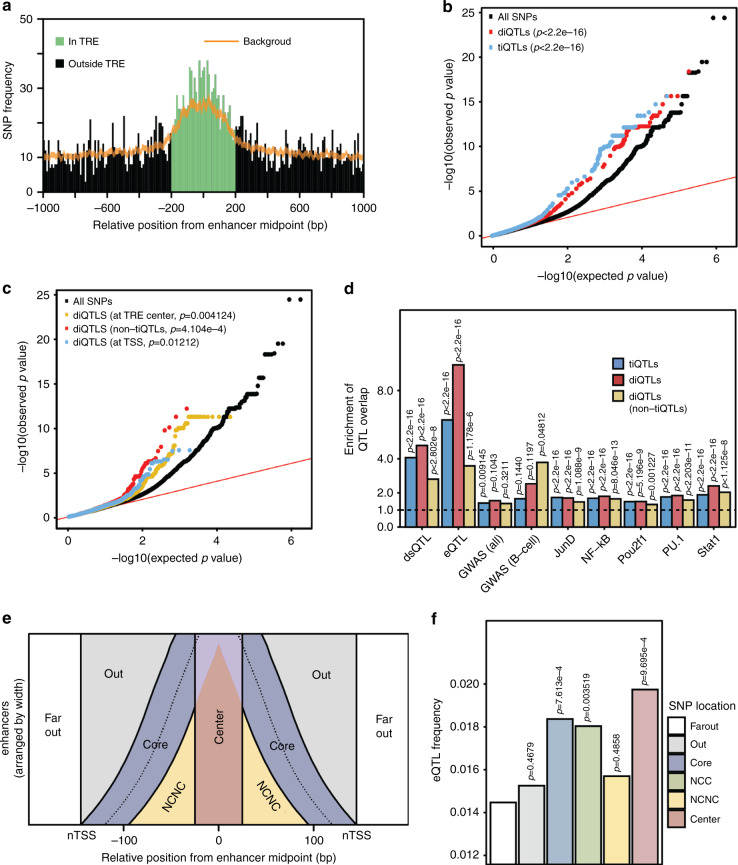
Fig. 5. ti- and diQTLs at enhancers associate with changes in gene expression.
a eQTLs are enriched at enhancers. A histogram of QTL density around enhancer midpoints with the expected background distribution with 99% confidence interval (sampled from all SNPs in the same region) shown in orange. b QQ plot of all p-values for each SNP group in eQTL discovery analysis. P-values use two-sided Kolmogorov–Smirnov test comparing to the all SNP distribution. c As in b for subgroups of diQTLs. Exact p-values are p = 0.0041, p = 4.1 × 10⁻⁴, and p = 0.012 respectively. d Enrichment of ti- and diQTLs in tTREs (±200 bp from center) containing other QTL types. Enrichment is computed compared to all SNPs in the same region. Overlap of QTL and background are compared for each bar with two-sided Fisher’s exact test. Exact p-values are p = 2.8 × 10⁻⁸, p = 1.2 × 10⁻⁶, p = 0.32, p = 0.048, p = 1.1 × 10⁻⁹, p = 8.0 × 10⁻¹³, p = 1.2 × 10⁻³, p = 2.2 × 10⁻¹¹, and p = 1.1 × 10⁻⁸ for diQTL (non-tiQTLs) across categories respectively, p = 5.2 × 10⁻⁹, 0.10, and 0.12 for diQTLs compared with POU2F1, all GWAS, and B-cell related GWAS respectively, p = 0.0091 and p = 0.14 for tiQTLs compared with all GWAS and B-cell GWAS respectively, and p < 2.2 × 10⁻¹⁶ for all other indicated p-values. Source data are provided as a Source Data file. e Diagram explaining the separation of candidate enhancer tTREs into functional regions. NCNC: non-center, non-core. f eQTL frequency in different enhancer regions. NCNC: non-center-non-core, NCC: non-center-core (core area does not overlap with center area). Each colored bar is compared to Far Out in a two-sided Fisher’s exact test. Exact p-values are p = 0.47, p = 7.6 × 10⁻⁴, p = 0.0035, p = 0.49, and p = 9.7 × 10⁻⁴.

