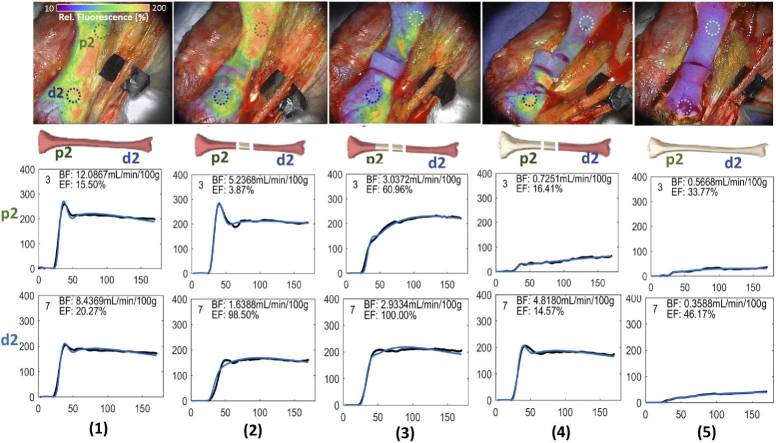
Fig. 3.
The images and change in fluorescence curves associated with one representative porcine tibia. ICG fluorescence map overlay on the white light images as well as temporal dynamic curves of the ICG kinetics in two regions of interest (most proximal (p2, green) and most distal(d2,, blue), shown in each image) at (1) baseline, (2) osteotomizing a 2 cm segment of bone, (3) 2 cm soft tissue/periosteal stripping proximal to the osteotomy, (4) complete soft tissue/periosteal stripping proximal to the osteotomy, (5) complete soft tissue/periosteal stripping proximal and distal to the osteotomy. To enhance visualization, the transparency of fluorescence information was increased in non-bone portions of the image. The dynamic change in fluorescence curves represent the raw data after smoothing with a 10-sec frame, 3rd-order Savitzky-Golay filter (black dots), and the result of fitting these curves with the HyPC model (blue line).

