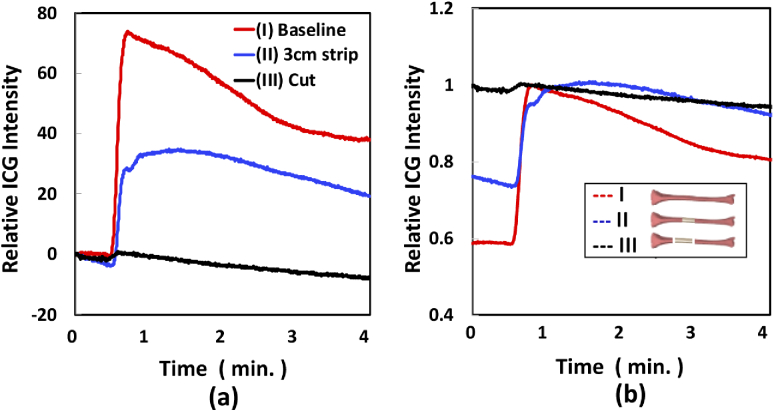
Fig. 5.
ICG kinetics in ROI (grey shadowed position in legend of (b)) at different conditions of (I) baseline (red), (II) ∼3 cm circumferential soft tissue stripping (blue) and (III) two diaphyseal osteotomies, separating this 3 cm of tibia (black). (a) ICG intensity after subtracting the average values of ICG before each injection, (b) ICG intensity normalized by the maximum ICG value in each condition.

