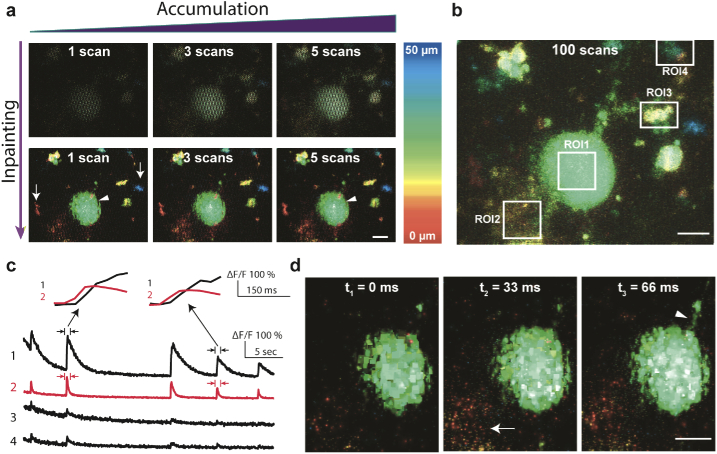
Fig. 5.
Volumetric imaging of calcium transient in a 3D neuronal culture. a) Depth-color coded images taken by Lissajous scan with time accumulation and inpainting. Integration over multiple scans improves image quality and resolution, albeit a loss in temporal resolution (top row). Inpainting algorithms compensate un-scanned voxels and thus the loss of information, improving the image quality (bottom row). b) Depth-color coded image acquired with 100 scans without inpainting (averaging for 3 seconds from T = 0 to T = 3, as a ground-truth image). c) Examples of calcium transients corresponding to the 4 different regions of interest (ROI) highlighted in (b). The intensity plots (ΔF/F) were recorded for a total of 35 seconds, showing typical peaks and subsequent decays caused by neuronal signaling. The magnified plots at two time points for ROI1 & ROI2 show that the signal started increasing at ROI2 before ROI1. d) Inpainted images at three consecutive time points with 33 millisecond intervals, taken at T=26 sec. The signal at 0 ms remained relatively low and increased after 33 ms at one particular area (arrow, ROI2 in panel d), and then after another 33 milliseconds, the signal increased at the dendrite-like structure (arrowhead). Depth color bar in (b) and (d) is the same as in (a). All images were cropped from the 4D data (a volume of 60 × 30 × 50 µm3, for 35 seconds) shown in Visualization 2 (1.6MB, mp4) and Visualization 3 (5.4MB, avi) . Scale bar is 5 µm in all images. Excitation at 488 nm, voxel size 0.062 × 0.062 × 1.8 µm3, fTAG = 458164 Hz, Lissajous period 2π.

