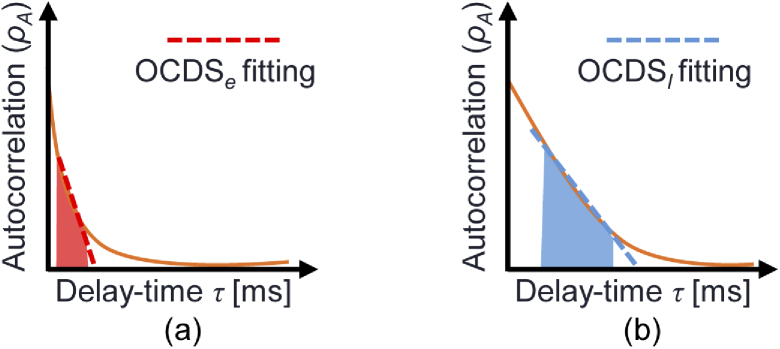
Fig. 1.
Schematics representing the definitions of the OCDSs. The curves in each figure represent the autocorrelations in which the fast (a) and slow (b) dynamics are dominant. and are defined at the red and blue regions, respectively. In the present case, these regions are [12.8, 64] ms for and [64, 627.2] ms for . The red and blue lines represent the slope for the and the , respectively.

