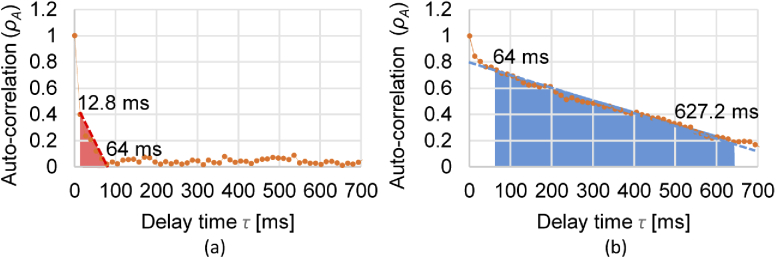
Fig. 2.
Experimentally obtained autocorrelation decay profiles of a tumor spheroid sample described in Section 4.1. The curves represent the autocorrelation decay of fast (a) and slow (b) dynamics tissue regions. The and computation ranges are highlighted as red and blue regions in (a) and (b), respectively.

