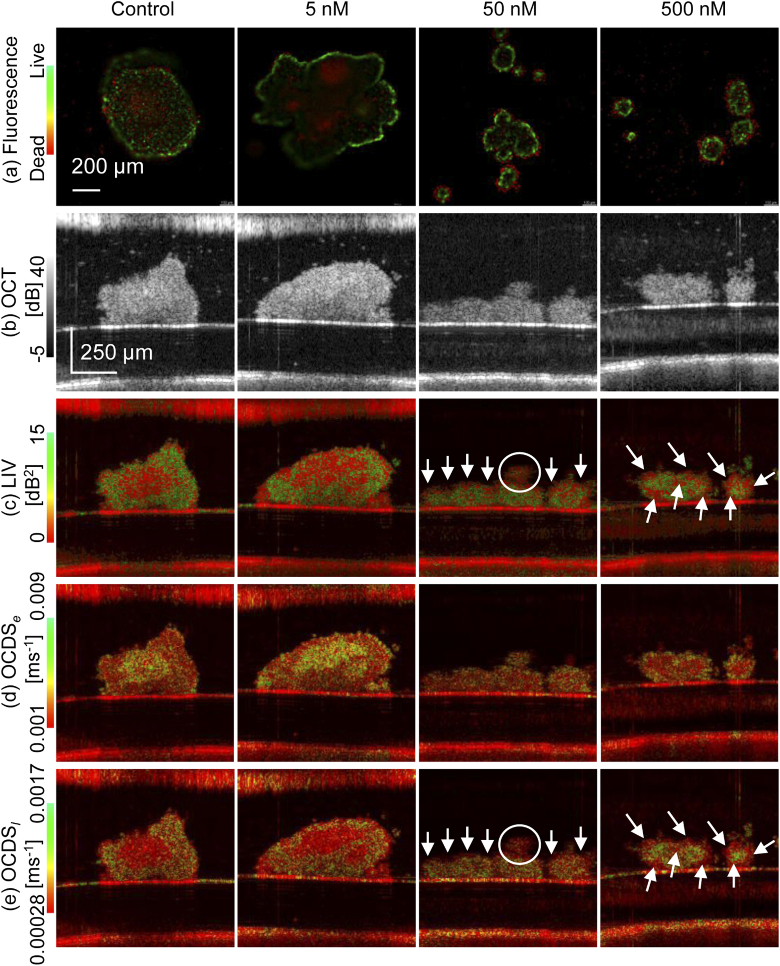
Fig. 6.
Drug response of MCF7 spheroids. The first to fifth rows represent the results from (a) fluorescence microscopy, (b) the OCT intensity image, (c) the LIV, (d) the , and (e) the . The fluorescence microscopy images are en face images, while the other images are all cross-sectional images. The columns represent the paclitaxel concentrations as 0 nM (control), 5 nM, 50 nM, and 500 nM from left to right.

