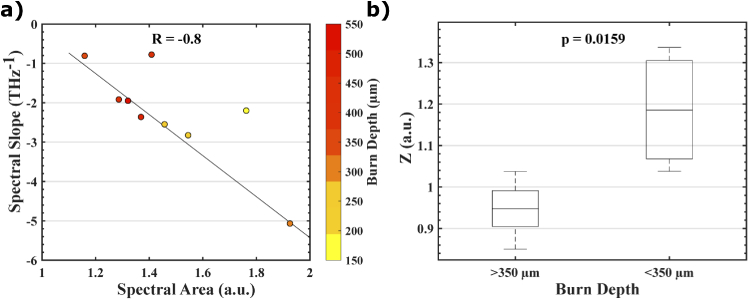
Fig. 5.
(a) shows a linear relationship (illustrated by the black least squares line in the scatter plot) between spectral area and spectral slope with the burn depth represented by the colored markers and the color axis. (b) A linear combination of spectral area and spectral slope, defined by the Z value in Eq. (1), shows statistically significant classification of superficial partial- and deep partial-thickness burns (Mann-Whitney U-Test, p = 0.0159).

