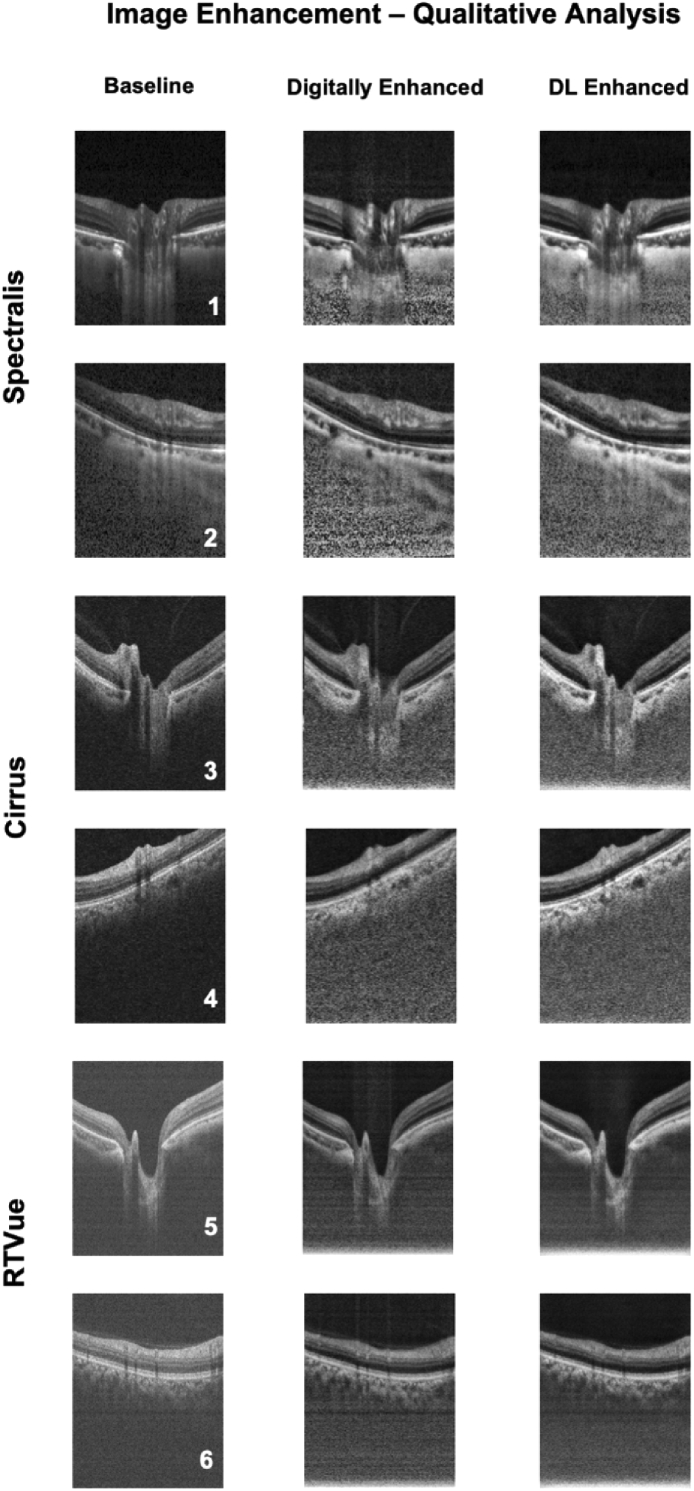
Fig. 3.
The qualitative performance of the image enhancement network is shown for six randomly selected (1-6) subjects (2 per device). The 1st, 2nd and 3rd columns represent the baseline, digitally-enhanced, and the corresponding DL-enhanced B-scans for patients imaged with Spectralis (1-2), Cirrus (3-4), and RTVue (5-6) devices, respectively.

