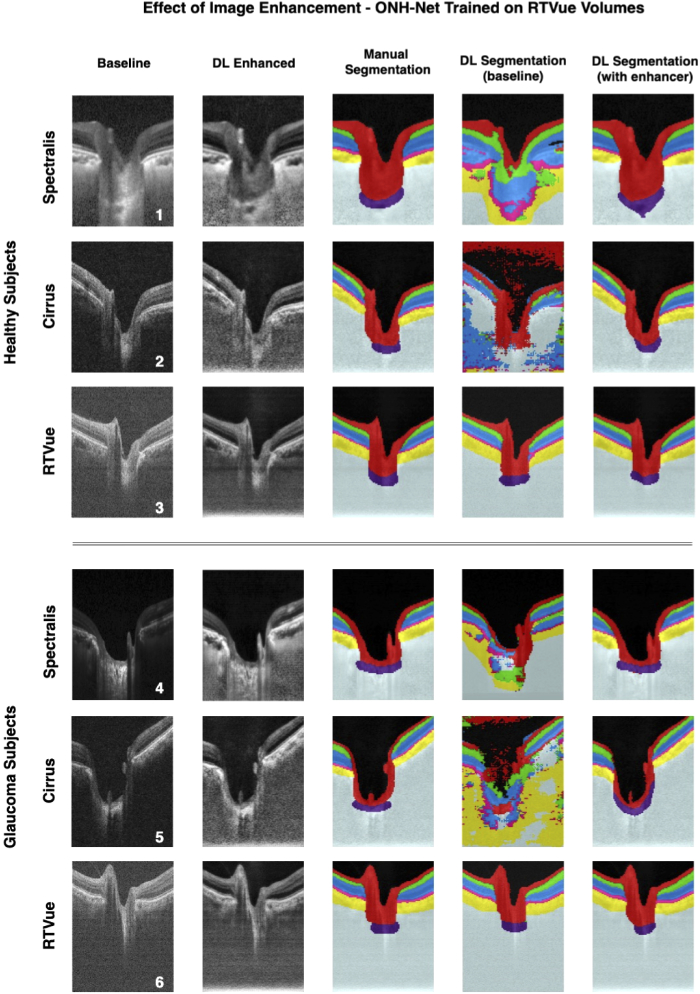
Fig. 6.
The qualitative performance (one randomly chosen B-scan per volume) of the ONH-Net 3D segmentation framework from three healthy (1-3) and three glaucoma (4-6) subjects is shown. The framework was trained on volumes from Cirrus, and tested on Spectralis (1, 4), Cirrus (2,5), and RTVue (3,6) devices respectively. The 1,st 2,nd and 3rd columns represent the baseline, DL enhanced, and the corresponding manual segmentation for the chosen B-scan. The 4th and 5th columns represent the DL segmentations when the ONH-Net was trained and tested using the baseline and DL enhanced volumes respectively.

