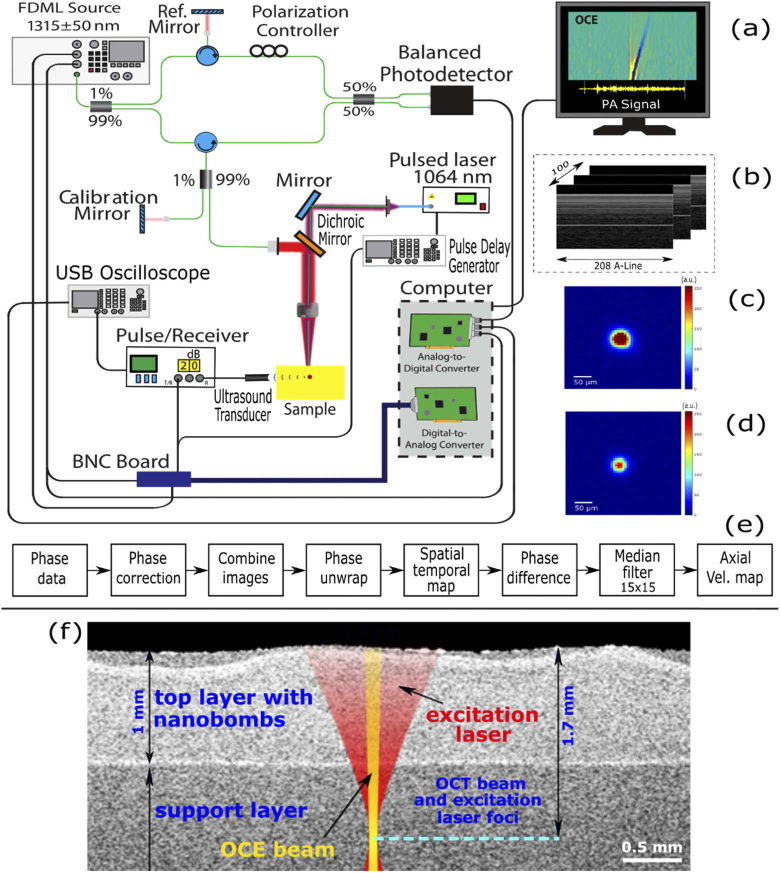
Fig. 2.
(a) Schematic of the OCE system and photoacoustic signal detection setup. (b) Continuous M-mode frames grouped in 100 sequential frames with 208 A-lines per frame; (c) and (d) beam profiles (8-bit image) of pump and FDML swept source lasers, respectively. (e) Post-processing flow chart. (f) Positions of the OCE and the excitation laser beams relative to phantom’s layered structure obtained by OCT.

