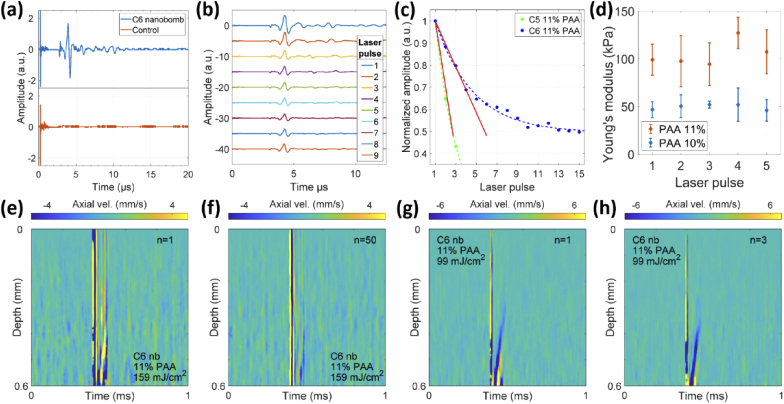
Fig. 5.
(a) PA signal from control sample 4 and C6 nanobomb sample 2. (b) PA signals from the same spot on the C6 nanobomb sample 1 after consecutive laser excitation pulses. (c) Comparison of PA signal decay during repetitive laser excitations of C6 nanobombs and C5 nanobombs both in 11% PAA phantoms measured at 159 mJ/cm2 laser fluence. (d) Comparison of Young’s modulus estimations as a function of consecutive laser excitations on the same spot on 10% and 11% PAA phantoms with C6 nanobombs (mean ± SD), n = 5-8 measurements per each PAA concentration/pulse number combination. Statistical analysis was done using ANOVA as described in the text. Spatiotemporal maps after the first (e) and the fiftieth (f) laser excitation pulses located on the same spot on sample 2 with C6 nanobombs. (g) and (h) The maps after the first (g) and the third (h) consecutive laser excitation pulses on C6 nanobomb sample 2 with reduced fluence of 99 mJ/cm2.

