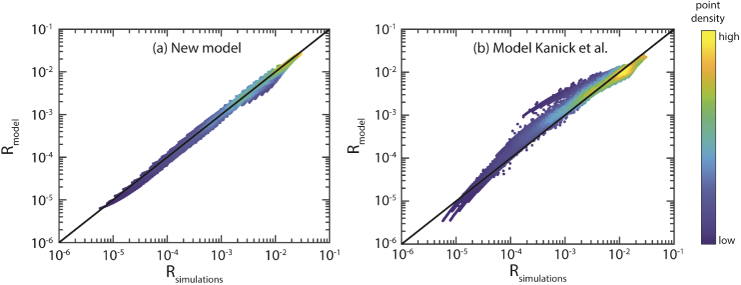
Fig. 5.
Reflectance as predicted by the model (Rmodel) versus the reflectance obtained from the MC simulations (Rsimulations). The black line depicts a perfect prediction. Since many points overlap, colors are used to indicate the density of points (blue = low, yellow = high). (a) For our model, the median error is 5.6% with a standard deviation of 8.8%. (b) For the model of Kanick et al. the median error is 19.3% with a standard deviation of 43.2%.

