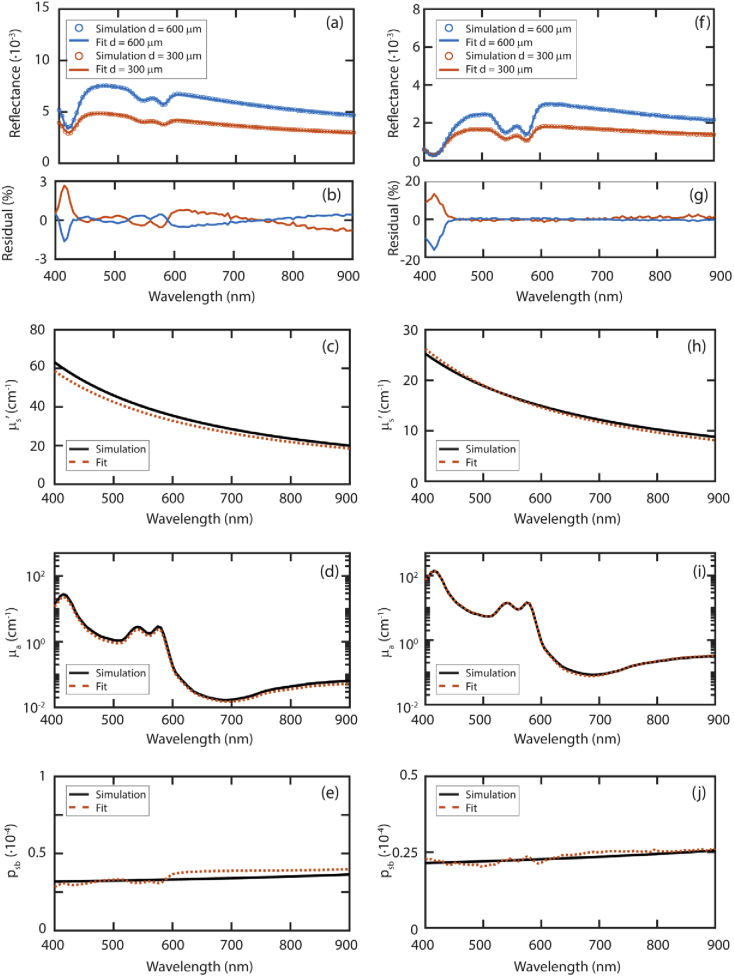
Fig. 7.
Fit on simulated spectra for skin (a) and soft tissue (f) and their fit residuals (b) and (g), respectively. Fit results for µs’ (c,h), µa (d,i) and psb (e,j) are shown here. Black lines indicate the simulated values, dashed red lines indicate the fit results. Input and fit parameters are in Table 4.

