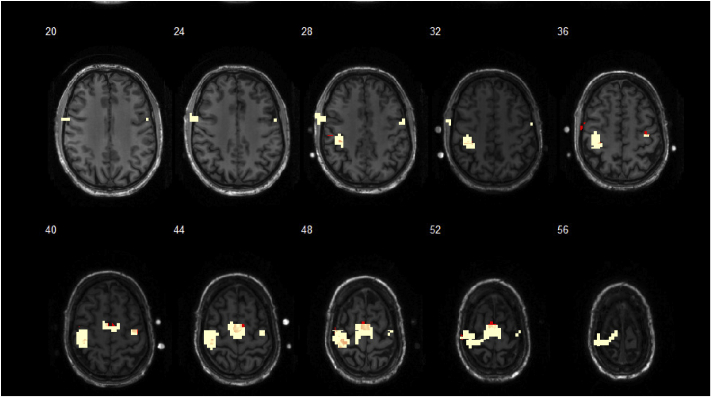
Fig. 6.
t-contrast maps of brain activation for the motor execution > rest contrast measured by DOT and fMRI devices. All results were mapped onto an individual space (subject’s anatomy image). Threshold p<0.001 corrected FDR at voxel level for BOLD signal (yellow) and HbO signal (red) onto the bilateral motor regions are shown. Note the fiducial marks on both cerebral sides to localize the position of the optical fiber grid.

