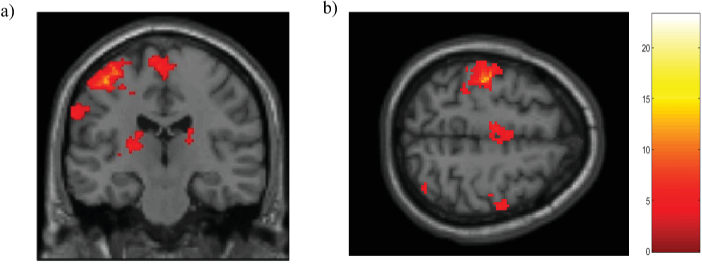
Fig. 10.
Cerebral activation maps of the motor execution > rest contrast measured fMRI devices in a subject group (N=8) using slice-based method in a) coronal view and b) axial view mapped onto a standard space (MNI). All results were mapped onto a standard space (MNI). Threshold p<0.001 corrected FDR at the voxel level for BOLD signal. Note the spatially independence networks associated to the maximum temporal activation profile during the motor execution.

