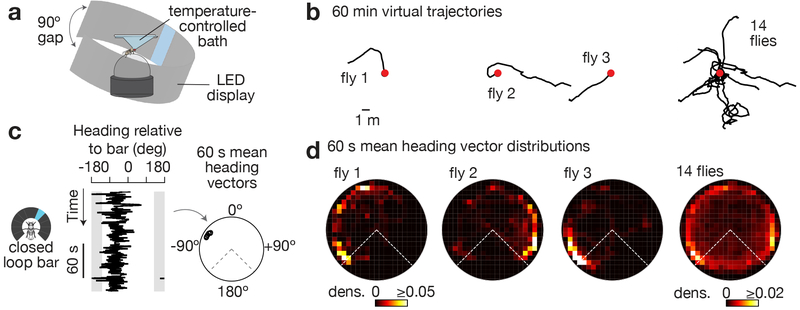
Figure 1. Tethered flies walk forward while maintaining a stable heading at an arbitrary angle relative to a visual landmark for minutes.
a, Tethered fly walking on a ball at the center of a 270° LED arena. b, 2D virtual trajectories of wild-type flies walking with a bright bar in closed-loop. Red dots indicate the starting point. Trajectories headed up on the page represent the flies walking towards the bar. c, Left: Heading relative to bar over 3 min for a sample fly. Right: We slid a 60 s analysis window over each heading trace and calculated the mean heading vector in each window (black circles, see Supplementary Figure 1 for Methods). d, Polar distributions of mean heading vectors taken over 60 s windows (slid by 1 s increments) for the flies shown above, in panel b. Time points in which flies were standing still (i.e. forward velocity < 0.5 mm/s) were ignored because heading values during such time points are stable for the trivial reason that the fly is not moving. Grey areas in c and dashed lines in d highlight the 90° gap of the LED display in which the bar is not visible.

