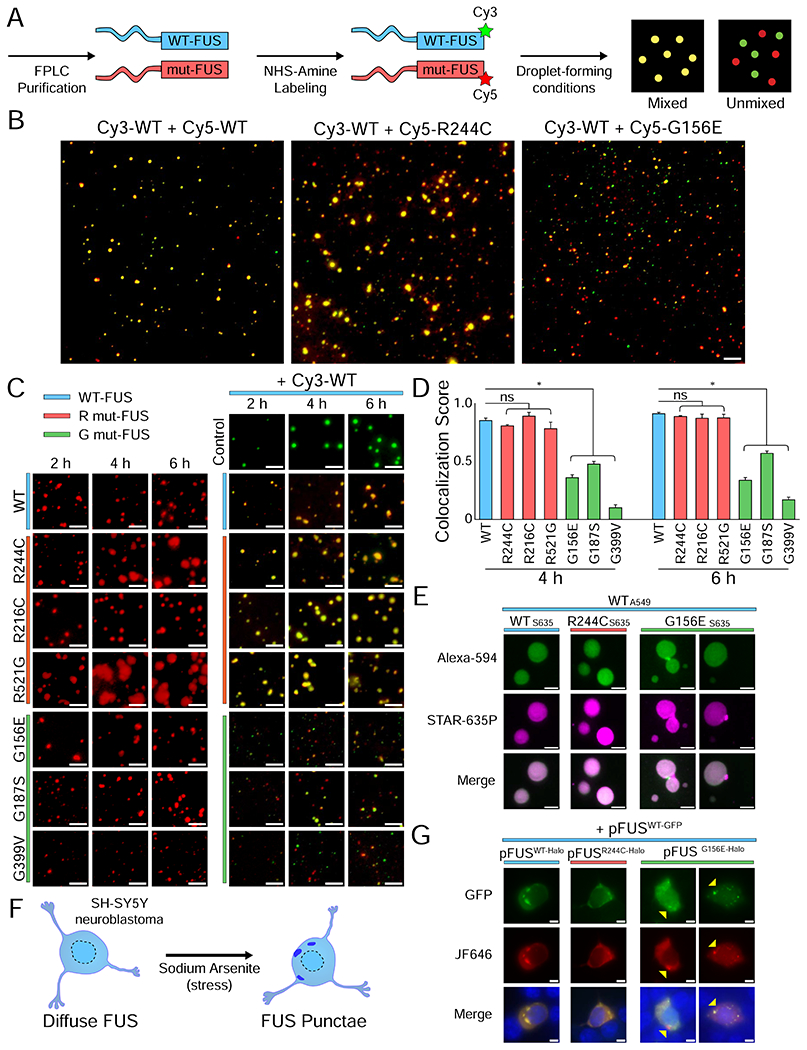
Figure 1: Glycine mutations in FUS lead to separate condensate formation.

(A) Schematic of purified and labeled FUS preparation for droplet experiments. (B) Wide-field images of 500 nM Cy3-WT FUS with 500 nM Cy5-WT, Cy5-R244C, or Cy5-G156E FUS, and 1 μM unlabeled U40 RNA after 2 h of incubation. Images were acquired in both the Cy3 (green) and Cy5 (red) channels and overlaid using Fiji and Adobe Photoshop CC 2019. The scale bar is 5 μm. (C) Wide-field images of Cy3-WT with Cy5-mutant FUS at 2 h, 4 h, and 6 h. The scale bar is 5 μm. (D) Quantification of (C) by using intensity masking and identifying overlapping droplets. The number of overlapping droplets was divided by the total number of droplets to calculate the colocalization score. Statistical significance was determined using a two-sample proportion z-test with ns = not significant and * = p < 0.05. (E) Stimulated emission depletion (STED) images of Alexa-594-labeled WT FUS with STAR-635P-labeled mutant FUS after 4 h of incubation. Unlabeled FUS was 1 μM concentration whereas labeled FUS was 10 nM. The scale bar is 500 nm. (F) Schematic of SH-SY5Y stress via sodium arsenite addition. (G) Live cell imaging of SH-SY5Y neuroblastoma cells transfected with 200 ng pFUSWT-GFP and 200 ng pFUSmut-Halo and stressed with 0.05 mM sodium arsenite for 1 h. Images show GFP, JF646, and overlay (GFP + JF646 + Hoechst) signal. Yellow arrows indicate granules with only G156E-Halo FUS signal and not WT-GFP FUS.
