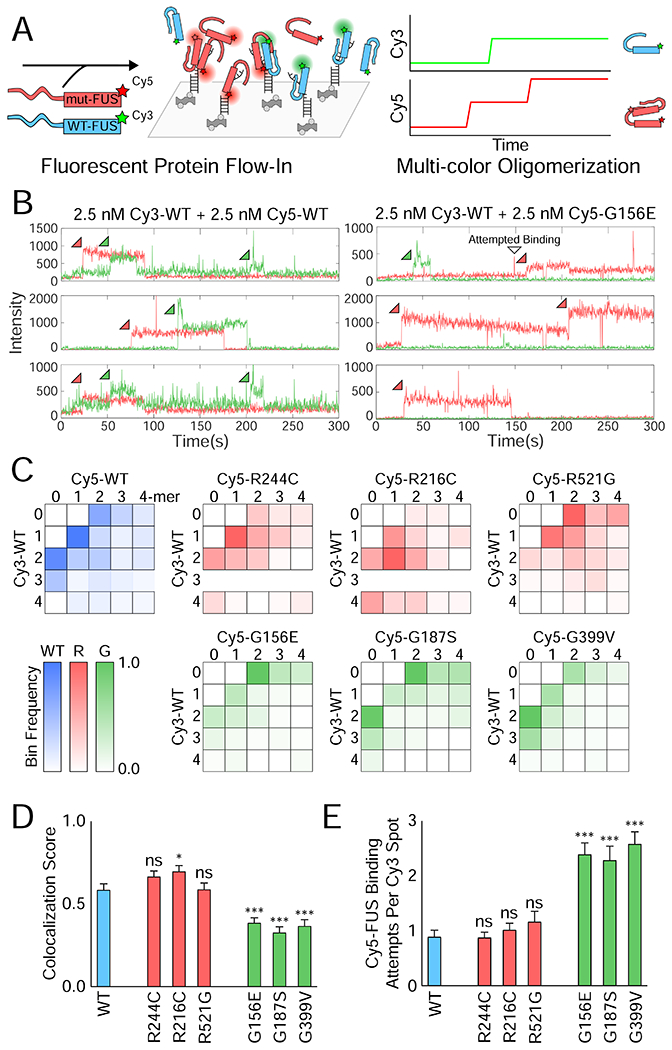
Figure 3: Two-color single-molecule nucleation of FUS shows reduced interactions between G mutant and wild-type FUS.

(A) Schematic depicting two-color FUS nucleation on a single-molecule RNA surface. (B) Example single-molecule traces showing Cy3 (green) and Cy5 (red) intensity over time for the green and red excitation of the single-molecule surface. Sample traces are shown for 2.5 nM Cy3-WT FUS with either 2.5 nM Cy5-WT or Cy5-G156E FUS simultaneously flowed into the flow cell. (C) Heatmaps of the normalized frequency of each combination of FUS multimers in reactions of 2.5 nM Cy3-WT and 2.5 nM Cy5-mutant FUS. For instance, the 1-1 bin corresponds to the frequency of traces with a monomer of Cy5-mutant and a monomer of Cy3-WT on that RNA molecule. More transparent bins denote a lower proportion of overall traces falling into the indicated bin (bottom left). (D) The FUS colocalization fraction calculated from (C) by dividing the number of traces with some combination of both FUS molecules (the interior of the heatmap) by the total number of 2-mer+ traces. Error was calculated from the proportion and the number of traces, and significance was determined using a two-sample proportion z-test where ns = not significant, * = p < 0.05, and *** = p < 0.001. (E) Quantification of the average number of binding attempts by Cy5-mutant FUS on traces that had Cy3-WT FUS bind first. Error bars denote SEM. Significance was calculated using a two-tailed two-sample Student’s t-test with *** = p < 0.001. Degrees of freedom were calculated using the Satterthwaite two-sample approximation.
