
Figure 5: G156E-FUS exerts a delayed disruptive effect on WT FUS RNA droplet fluidity.
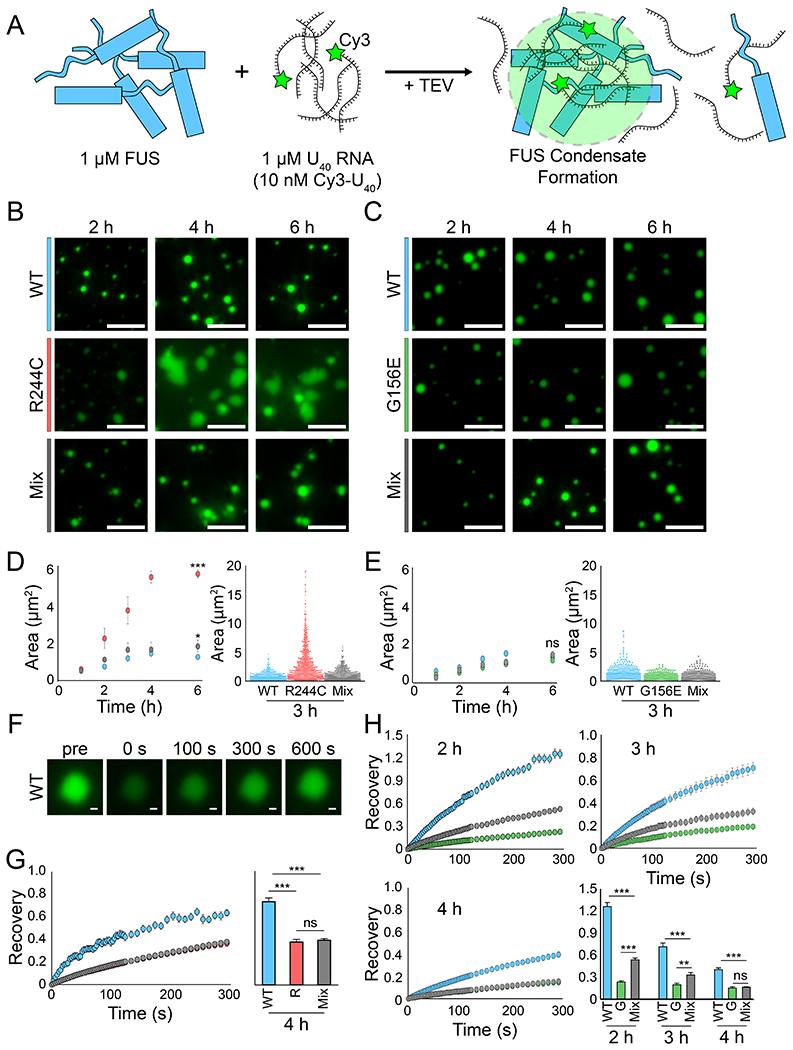
(A) Schematic detailing the experimental setup in which 1 μM FUS is combined with 1 μM (1:100 Cy3-labeled:unlabeled) U40 RNA to form droplets. (B) Representative wide-field images of WT, R244C, and WT/R244C mixed (500 nM each) droplets at 2 h, 4 h, and 6 h. The scale bar is 5 μm. (C) Same as (B) but with G156E and WT/G156E mixed droplets instead. (D) Area quantification (WT = blue, R244C = red, mix = gray) of the droplets from (B) via intensity thresholding and ROI auto-selection. Left, scatter plot of area versus time. Error is standard deviation. Right, dot plot of all droplet areas for the 3 h time point. (E) Same as (D) but with G156E (green). (F) Representative fluorescence recovery after photobleaching (FRAP) images from WT FUS at the 3 h time point for one droplet. The scale bar is 0.5 μm. (G) Left, fluorescence recovery for WT, R244C, and WT/R244C mixed droplets at 4 h over 300 s. Error is SEM with n = 8. Right, bar plot of recovery at the 300 s time point. (H) Same as (G) but for G156E and WT/G156E mixed droplets at 2 h, 3 h, and 4 h. All statistics for this figure are calculated using a two-tailed two-sample Student’s t-test with ns = not significant, * = p < 0.05, ** = p < 0.01, and *** = p < 0.001. Degrees of freedom were calculated using the Satterthwaite two-sample approximation.