
Figure 6: ALS/FTLD-linked G156E mutation disrupts the LLPS of FUS due to a bulky amino acid substitution.
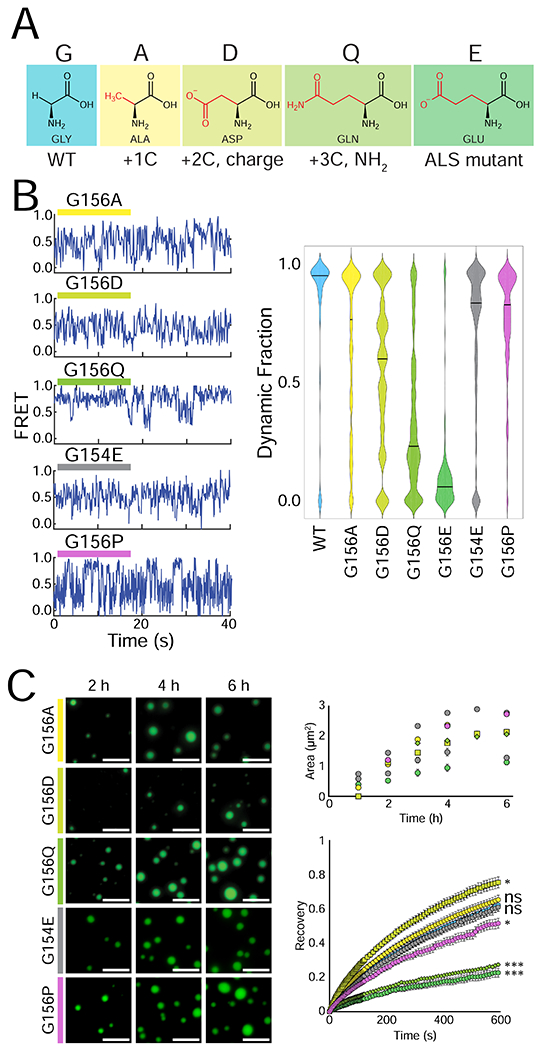
(A) Structures of the different amino acids introduced at position 156. (B) Representative smFRET traces of 500 nM G156A, G156D, G156Q, G154E, and G156P FUS with 50 pM FRET-labeled pdU50 RNA. The dynamic fraction of >100 molecules was quantified and is visualized with a violin plot. (C) Wide-field images of 1 μM G156A, G156D, G156Q, G154E and G156P FUS with 1 μM U40 RNA and TEV protease at 2 h, 4 h, and 6 h. The fluorescent signal is 10 nM U40 RNA, and the scale bar is 5 μm. Droplet area was quantified by intensity thresholding and is plotted over time, and droplet fluorescence recovery after photobleaching is shown for the 4 h timepoint: G156E = green circle, G156A = yellow circle, G156D = yellow-green square, G156Q = lime diamond, G154E = gray circle, and G156P = purple circle. Significance was calculated using a two-tailed two-sample Student’s t-test with ns = not significant, * = p < 0.05, ** = p < 0.01, and *** = p < 0.001. Degrees of freedom were calculated using the Satterthwaite two-sample approximation.