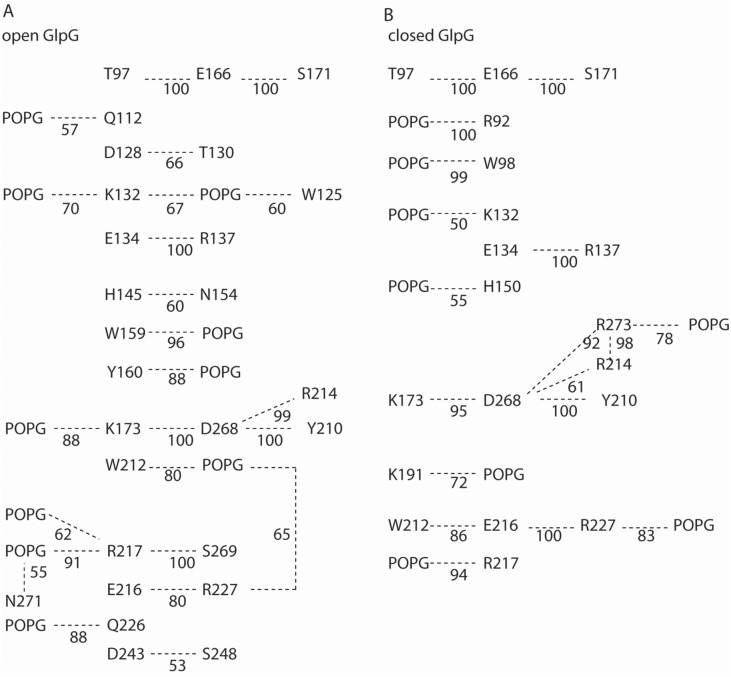
Fig. 7.
Illustration of selected H-bonds of open vs. closed GlpG in a hydrated POPG bilayer. H-bonds were computed from the last 35 ns and last 36 ns of the open GlpG and closed GlpG simulations, respectively, using as criteria a distance between heavy atoms of ≤ 3.5 Å, and a H-bond angle of ≤ 60°. For simplicity, only lipids within 6 Å of the protein at the end of the simulation were included in the search for H-bonds, and only those H-bonds are shown that are present for at least 50% of the trajectory segment used for analyses. a, b Schematic illustration of selected H-bond networks of open (panel a) vs. closed GlpG (panel b)

